## Line Chart: Exact Match vs. Data Percentage for k=2 and k=3
### Overview
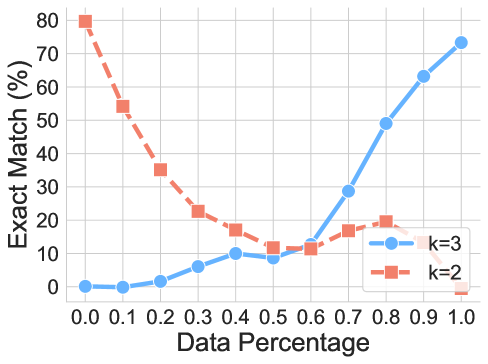
The image is a line chart comparing the "Exact Match (%)" against "Data Percentage" for two different values of 'k' (k=2 and k=3). The x-axis represents the Data Percentage, ranging from 0.0 to 1.0 in increments of 0.1. The y-axis represents the Exact Match in percentage, ranging from 0 to 80 in increments of 10. Two lines are plotted: one for k=3 (blue with circle markers) and one for k=2 (coral/orange with square markers).
### Components/Axes
* **X-axis:** Data Percentage, ranging from 0.0 to 1.0 with increments of 0.1.
* **Y-axis:** Exact Match (%), ranging from 0 to 80 with increments of 10.
* **Legend:** Located in the bottom-right corner.
* k=3: Blue line with circle markers.
* k=2: Coral/Orange dashed line with square markers.
### Detailed Analysis
* **k=3 (Blue line with circle markers):**
* Trend: Initially near 0, the line gradually increases with data percentage, showing a positive correlation after a data percentage of 0.5.
* Data Points:
* 0.0 Data Percentage: ~0% Exact Match
* 0.1 Data Percentage: ~0% Exact Match
* 0.2 Data Percentage: ~2% Exact Match
* 0.3 Data Percentage: ~6% Exact Match
* 0.4 Data Percentage: ~10% Exact Match
* 0.5 Data Percentage: ~10% Exact Match
* 0.6 Data Percentage: ~12% Exact Match
* 0.7 Data Percentage: ~28% Exact Match
* 0.8 Data Percentage: ~48% Exact Match
* 0.9 Data Percentage: ~62% Exact Match
* 1.0 Data Percentage: ~72% Exact Match
* **k=2 (Coral/Orange dashed line with square markers):**
* Trend: Initially high, the line decreases with data percentage until around 0.5, then slightly increases before dropping again at 1.0.
* Data Points:
* 0.0 Data Percentage: ~80% Exact Match
* 0.1 Data Percentage: ~54% Exact Match
* 0.2 Data Percentage: ~35% Exact Match
* 0.3 Data Percentage: ~22% Exact Match
* 0.4 Data Percentage: ~17% Exact Match
* 0.5 Data Percentage: ~12% Exact Match
* 0.6 Data Percentage: ~10% Exact Match
* 0.7 Data Percentage: ~17% Exact Match
* 0.8 Data Percentage: ~19% Exact Match
* 0.9 Data Percentage: ~3% Exact Match
* 1.0 Data Percentage: ~0% Exact Match
### Key Observations
* For k=3, the exact match percentage increases as the data percentage increases.
* For k=2, the exact match percentage decreases as the data percentage increases, with a slight increase around 0.7 to 0.8.
* The k=2 line starts with a much higher exact match percentage than the k=3 line.
* The k=3 line surpasses the k=2 line in exact match percentage around a data percentage of 0.6.
### Interpretation
The chart illustrates how the exact match percentage varies with the amount of data used, for different values of 'k'. When k=2, the exact match is high with very little data, but quickly degrades as more data is added. This suggests that with k=2, the algorithm is very sensitive to the addition of new data points. Conversely, when k=3, the exact match starts low but improves significantly as more data is incorporated. This indicates that k=3 benefits from a larger dataset to achieve better accuracy. The crossover point around 0.6 data percentage suggests that for datasets larger than this threshold, k=3 is the preferred parameter.