## Bar Chart: Attack Types vs RtA
### Overview
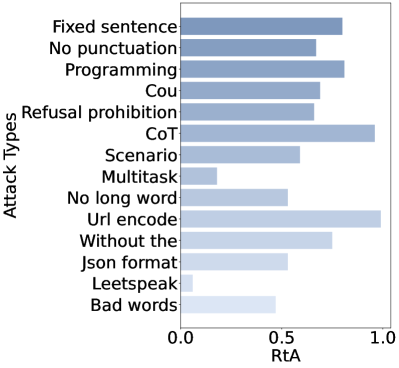
The image is a horizontal bar chart comparing the "RtA" (likely "Retrieval Accuracy" or similar metric) values across 13 different "Attack Types." The chart uses varying shades of blue to represent data points, with no explicit legend provided. The x-axis ranges from 0.0 to 1.0, while the y-axis lists attack types in descending order of RtA values.
### Components/Axes
- **Y-Axis (Attack Types)**:
Fixed sentence, No punctuation, Programming, Cou, Refusal prohibition, CoT, Scenario, Multitask, No long word, Url encode, Without the, Json format, Leetspeak, Bad words.
- **X-Axis (RtA)**:
Scale from 0.0 to 1.0 in increments of 0.1.
- **Legend**:
No explicit legend is present. Colors range from dark blue (high RtA) to light blue (low RtA), but no labels or keys are visible.
### Detailed Analysis
- **Highest RtA**:
- **Url encode**: ~1.0 (darkest blue, longest bar).
- **Fixed sentence**: ~0.85 (dark blue).
- **No punctuation**: ~0.8 (dark blue).
- **Programming**: ~0.8 (dark blue).
- **Cou**: ~0.75 (medium blue).
- **Refusal prohibition**: ~0.75 (medium blue).
- **CoT**: ~0.95 (dark blue, second-longest bar).
- **Mid-Range RtA**:
- **Scenario**: ~0.6 (light blue).
- **No long word**: ~0.55 (light blue).
- **Json format**: ~0.55 (light blue).
- **Bad words**: ~0.5 (light blue).
- **Lowest RtA**:
- **Multitask**: ~0.1 (lightest blue, shortest bar).
- **Leetspeak**: ~0.05 (lightest blue, shortest bar).
### Key Observations
1. **Outliers**:
- **Multitask** and **Leetspeak** are extreme outliers with RtA values far below the cluster of other attack types.
- **Url encode** and **CoT** dominate with the highest RtA values.
2. **Clustering**:
Most attack types (e.g., Fixed sentence, Programming, Cou) cluster between 0.5 and 0.8, suggesting moderate to high effectiveness.
3. **Color Correlation**:
Darker blues correspond to higher RtA values, while lighter blues indicate lower values. However, without a legend, this is inferred visually.
### Interpretation
The chart highlights significant variability in RtA across attack types. **Url encode** and **CoT** appear to be the most effective or frequently used attacks, while **Multitask** and **Leetspeak** are markedly less so. The lack of a legend limits interpretation of color coding, but the visual gradient suggests a direct relationship between color intensity and RtA magnitude. The outlier status of **Multitask** and **Leetspeak** may indicate unique challenges or inefficiencies in these attack strategies compared to others. This data could inform prioritization of defenses or optimizations in systems vulnerable to these attacks.