TECHNICAL ASSET FINGERPRINT
3b63a06b8f1123beacd4dbfb
Click to view fullscreen
Press ESC or click to close
FOUND IN PAPERS
EXPERT: gemini-2.0-flash VERSION 1
RUNTIME: nugit/gemini/gemini-2.0-flash
INTEL_VERIFIED
## Memristor Circuit Analysis
### Overview
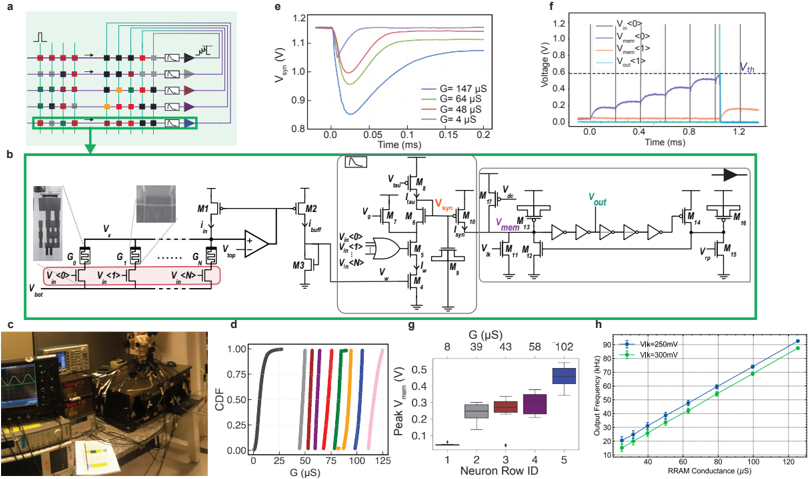
The image presents a comprehensive analysis of a memristor-based circuit, encompassing circuit diagrams, experimental setup, and performance characterization through various plots and graphs. It includes circuit schematics, cumulative distribution functions (CDFs), transient response plots, and frequency response curves, providing a detailed overview of the circuit's behavior and characteristics.
### Components/Axes
**a) Memristor Array Diagram:**
* A 5x5 grid of memristor devices.
* Each row is connected to a circuit represented by a triangle with an arrow.
* Input pulse shown on the left.
* Green box highlights a specific row.
**b) Circuit Schematic:**
* Left: Memristor array with memristors labeled G0 to GN. Input voltages V<0> to V<N> are applied to the memristors. Vbot and Vtop are indicated.
* Center: A CMOS circuit with transistors labeled M1, M2, and M3.
* Right: A more complex circuit involving transistors M4 to M17, with key voltages Vsyn, Vmem, and Vout labeled.
**c) Experimental Setup Photograph:**
* A photograph of the experimental setup, including a computer screen displaying a waveform, various electronic instruments, and the circuit under test.
**d) Cumulative Distribution Function (CDF) Plot:**
* X-axis: G (µS), ranging from 0 to 125.
* Y-axis: CDF, ranging from 0 to 1.00.
* Multiple CDF curves, each representing a different condition or device.
**e) Transient Response Plot:**
* X-axis: Time (ms), ranging from 0 to 0.2.
* Y-axis: Vsyn (V), ranging from 0.8 to 1.2.
* Four curves representing different conductance values: G = 147 µS (blue), G = 64 µS (red), G = 48 µS (green), and G = 4 µS (purple).
**f) Voltage Response Plot:**
* X-axis: Time (ms), ranging from 0 to 1.2.
* Y-axis: Voltage (V), ranging from 0 to 1.2.
* Curves representing V<0> (grey), Vmem (black), V<1> (red), and Vout (blue).
* A horizontal dashed line indicates the threshold voltage Vth.
**g) Peak Vmem vs. Neuron Row ID Box Plot:**
* X-axis: Neuron Row ID, ranging from 1 to 5.
* Y-axis: Peak Vmem (V), ranging from 0 to 0.5.
* Box plots showing the distribution of peak Vmem for each neuron row.
* Top axis: G (µS) values corresponding to each Neuron Row ID: 8, 39, 43, 58, 102.
**h) Output Frequency vs. RRAM Conductance Plot:**
* X-axis: RRAM Conductance (µS), ranging from 20 to 120.
* Y-axis: Output Frequency (kHz), ranging from 10 to 90.
* Two curves representing different bias voltages: Vlk = 250mV (blue) and Vlk = 300mV (green).
### Detailed Analysis
**a) Memristor Array Diagram:**
* The diagram shows a 5x5 array of memristors. Each memristor is represented by a square. The color of the squares varies, but the significance of the color is not immediately apparent from the diagram itself.
* Each row of memristors is connected to a circuit, possibly an amplifier or readout circuit, indicated by a triangle with an arrow.
* The green box highlights a specific row, suggesting it is the focus of further analysis or experimentation.
**b) Circuit Schematic:**
* The circuit schematic is divided into three main sections.
* The left section shows the memristor array with memristors labeled G0 to GN. Input voltages V<0> to V<N> are applied to the memristors. Vbot and Vtop are indicated.
* The center section shows a CMOS circuit with transistors labeled M1, M2, and M3. This section likely serves as a buffer or amplifier for the memristor array output.
* The right section shows a more complex circuit involving transistors M4 to M17, with key voltages Vsyn, Vmem, and Vout labeled. This section likely implements the core functionality of the circuit, such as signal processing or computation.
**c) Experimental Setup Photograph:**
* The photograph shows a typical experimental setup for testing electronic circuits.
* A computer screen displays a waveform, likely showing the output of the circuit under test.
* Various electronic instruments, such as power supplies, signal generators, and oscilloscopes, are visible.
* The circuit under test is likely located on the black breadboard in the center of the image.
**d) Cumulative Distribution Function (CDF) Plot:**
* The CDF plot shows the distribution of memristor conductance values.
* Each curve represents a different condition or device.
* The curves are clustered in distinct regions, suggesting that the memristors can be programmed to different conductance states.
* The CDF curves shift to the right as the conductance increases.
**e) Transient Response Plot:**
* The transient response plot shows the response of the circuit to a pulse input.
* The Y-axis, Vsyn (V), represents the voltage at the synapse.
* The curves show the voltage response for different memristor conductance values.
* The voltage drops rapidly after the pulse is applied and then recovers gradually.
* The magnitude of the voltage drop is larger for higher conductance values.
* G = 147 µS (blue): The voltage drops to approximately 0.85V at 0.03ms and recovers to approximately 1.15V at 0.2ms.
* G = 64 µS (red): The voltage drops to approximately 0.9V at 0.03ms and recovers to approximately 1.15V at 0.15ms.
* G = 48 µS (green): The voltage drops to approximately 0.95V at 0.03ms and recovers to approximately 1.15V at 0.1ms.
* G = 4 µS (purple): The voltage remains relatively constant at approximately 1.17V.
**f) Voltage Response Plot:**
* The voltage response plot shows the voltage at different points in the circuit over time.
* V<0> (grey): Remains at approximately 1.2V.
* Vmem (black): Increases in steps, reaching approximately 0.6V at 0.8ms, then spikes to approximately 1.2V at 1.1ms.
* V<1> (red): Remains at approximately 0V until 1.1ms, then rises to approximately 0.2V.
* Vout (blue): Remains at approximately 0V until 1.1ms, then rises to approximately 0.8V.
* The threshold voltage Vth is indicated by a horizontal dashed line at approximately 0.6V.
**g) Peak Vmem vs. Neuron Row ID Box Plot:**
* The box plot shows the distribution of peak Vmem values for each neuron row.
* The peak Vmem values increase with increasing Neuron Row ID.
* The box plots show the median, quartiles, and outliers for each distribution.
* Neuron Row ID 1 (G = 8 µS): Peak Vmem is approximately 0.1V.
* Neuron Row ID 2 (G = 39 µS): Peak Vmem is approximately 0.25V.
* Neuron Row ID 3 (G = 43 µS): Peak Vmem is approximately 0.3V.
* Neuron Row ID 4 (G = 58 µS): Peak Vmem is approximately 0.35V.
* Neuron Row ID 5 (G = 102 µS): Peak Vmem is approximately 0.5V.
**h) Output Frequency vs. RRAM Conductance Plot:**
* The output frequency increases linearly with increasing RRAM conductance.
* The output frequency is higher for Vlk = 300mV (green) than for Vlk = 250mV (blue).
* Vlk = 250mV (blue): The output frequency ranges from approximately 15 kHz at 30 µS to approximately 85 kHz at 120 µS.
* Vlk = 300mV (green): The output frequency ranges from approximately 20 kHz at 30 µS to approximately 90 kHz at 120 µS.
### Key Observations
* The memristor conductance can be programmed to different states, as shown by the CDF plot.
* The transient response of the circuit is dependent on the memristor conductance, with higher conductance values resulting in larger voltage drops.
* The peak Vmem value increases with increasing Neuron Row ID, indicating that the memristor conductance is increasing along the row.
* The output frequency of the circuit increases linearly with increasing RRAM conductance.
### Interpretation
The data suggests that the memristor-based circuit is functioning as intended. The memristors can be programmed to different conductance states, and the circuit's response is dependent on the memristor conductance. The linear relationship between output frequency and RRAM conductance suggests that the circuit can be used for analog signal processing or computation. The different bias voltages (Vlk) allow for tuning the circuit's performance. The circuit's behavior is consistent with the expected behavior of a memristor-based system. The results demonstrate the potential of memristors for use in neuromorphic computing and other applications.
DECODING INTELLIGENCE...
EXPERT: nemotron-free VERSION 1
RUNTIME: free/nvidia/nemotron-nano-12b-v2-vl:free
INTEL_VERIFIED
## Circuit and Graph Analysis: Neuromorphic System Components and Performance Metrics
### Overview
The image presents a multi-part technical diagram and experimental data visualization for a neuromorphic computing system. It includes circuit schematics (a, b), voltage-time graphs (e, f), a CCDF plot (d), box plots (g), and a scatter plot (h), alongside a photograph of experimental hardware (c).
---
### Components/Axes
#### a) Circuit Diagram (Top-Left)
- **Components**:
- Colored squares (red, black, gray, green, yellow) represent memory elements (M1-M18) with directional arrows indicating signal flow.
- Purple arrows denote control signals; blue arrows represent data paths.
- Labels: `V_in`, `V_out`, `V_th`, `V_mem`, `V_bot`, `V_top`.
- **Legend**:
- Red: `V_in`, Black: `V_mem`, Gray: `V_bot`, Green: `V_top`, Yellow: `V_th`.
- Symbols: `▶` (data flow), `↑` (control), `△` (threshold).
#### e) Voltage-Time Graph (Top-Center)
- **Axes**:
- X-axis: Time (ms), Y-axis: Voltage (V).
- Data series: Four curves labeled `G = 147 μS` (blue), `64 μS` (green), `48 μS` (red), `4 μS` (purple).
- **Trends**:
- All curves show a V-shaped dip followed by saturation. Lower G values (e.g., 4 μS) exhibit slower recovery.
#### f) Voltage Threshold Graph (Top-Right)
- **Axes**:
- X-axis: Time (ms), Y-axis: Voltage (V).
- Data series: Threshold voltages (`V_th = 0.6 V`), input (`V_in`), memory (`V_mem`), and output (`V_out`) voltages.
- **Trends**:
- `V_mem` transitions from 0.1 V to 0.3 V at ~0.8 ms, triggering `V_out` to rise sharply.
#### b) Expanded Circuit Diagram (Center)
- **Components**:
- Memory array (M1-M18) with voltage-controlled switches (`V_x`, `V_y`).
- Buffers (`M3`, `M4`), comparators (`M5`, `M6`), and output drivers (`M14`, `M18`).
- Labels: `V_in`, `V_buff`, `V_mem`, `V_out`, `V_th`.
#### d) CCDF Plot (Bottom-Left)
- **Axes**:
- X-axis: Conductance (G, μS), Y-axis: CCDF (Cumulative Distribution Function).
- Curves: 25, 50, 75, 100, 125 μS (colors: gray to pink).
- **Trends**:
- Steeper curves at lower G values indicate higher probability of low conductance states.
#### g) Box Plot (Bottom-Center)
- **Axes**:
- X-axis: Neuron Row ID (1-5), Y-axis: Peak Voltage (V).
- Data: Median voltages (0.1-0.3 V), interquartile ranges (0.05-0.15 V).
- **Trends**:
- Row 5 shows the highest median voltage (0.3 V), Row 1 the lowest (0.1 V).
#### h) Scatter Plot (Bottom-Right)
- **Axes**:
- X-axis: RRAM Conductance (μS), Y-axis: Output Frequency (kHz).
- Data: Blue (`V_th = 250 mV`), Green (`V_th = 300 mV`).
- **Trends**:
- Linear correlation: Higher conductance increases frequency (e.g., 125 μS → 90 kHz for 250 mV).
---
### Key Observations
1. **Voltage Dynamics (e, f)**: Lower conductance (G) results in slower voltage recovery, critical for timing precision in neuromorphic systems.
2. **Threshold Behavior (f)**: `V_mem` hysteresis (0.1 V → 0.3 V) suggests non-volatile memory retention.
3. **Conductance Distribution (d)**: Most devices cluster at 50-75 μS, with outliers at 25 μS (high leakage) and 125 μS (high retention).
4. **Neuron Variability (g)**: Row 5’s elevated voltage may indicate defective or optimized memory cells.
5. **Frequency-Scale Relationship (h)**: Conductance directly impacts operational speed, with 300 mV threshold enabling higher frequencies.
---
### Interpretation
The system demonstrates a voltage-controlled memory array with conductance-dependent timing characteristics. The CCDF plot (d) reveals a bimodal distribution of device performance, suggesting manufacturing variability. The box plot (g) highlights Row 5 as a potential outlier, warranting further inspection. The scatter plot (h) confirms that optimizing RRAM conductance and threshold voltage (`V_th`) is critical for achieving high-frequency operation. The circuit diagrams (a, b) illustrate a hierarchical architecture where memory cells (`M1-M18`) interface with logic gates (`M3-M6`) to process signals, with `V_th` acting as a critical control parameter. Experimental hardware (c) validates the system’s physical implementation, though thermal management (not shown) may affect real-world performance.
DECODING INTELLIGENCE...