## Circuit and Graph Analysis: Neuromorphic System Components and Performance Metrics
### Overview
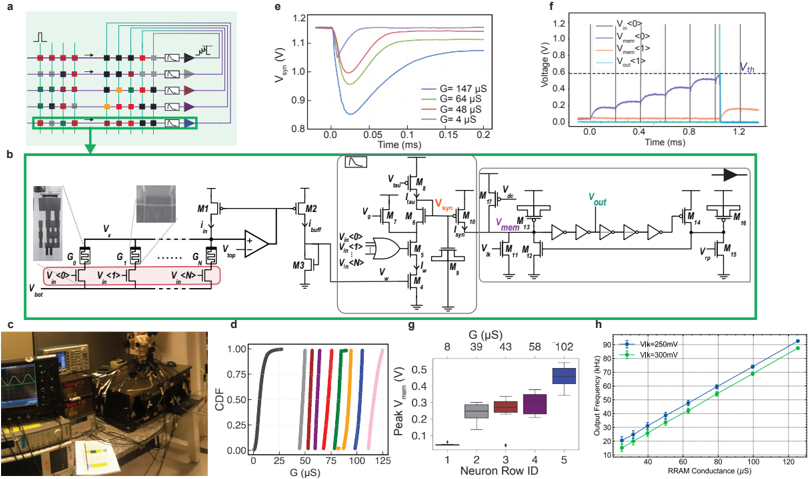
The image presents a multi-part technical diagram and experimental data visualization for a neuromorphic computing system. It includes circuit schematics (a, b), voltage-time graphs (e, f), a CCDF plot (d), box plots (g), and a scatter plot (h), alongside a photograph of experimental hardware (c).
---
### Components/Axes
#### a) Circuit Diagram (Top-Left)
- **Components**:
- Colored squares (red, black, gray, green, yellow) represent memory elements (M1-M18) with directional arrows indicating signal flow.
- Purple arrows denote control signals; blue arrows represent data paths.
- Labels: `V_in`, `V_out`, `V_th`, `V_mem`, `V_bot`, `V_top`.
- **Legend**:
- Red: `V_in`, Black: `V_mem`, Gray: `V_bot`, Green: `V_top`, Yellow: `V_th`.
- Symbols: `▶` (data flow), `↑` (control), `△` (threshold).
#### e) Voltage-Time Graph (Top-Center)
- **Axes**:
- X-axis: Time (ms), Y-axis: Voltage (V).
- Data series: Four curves labeled `G = 147 μS` (blue), `64 μS` (green), `48 μS` (red), `4 μS` (purple).
- **Trends**:
- All curves show a V-shaped dip followed by saturation. Lower G values (e.g., 4 μS) exhibit slower recovery.
#### f) Voltage Threshold Graph (Top-Right)
- **Axes**:
- X-axis: Time (ms), Y-axis: Voltage (V).
- Data series: Threshold voltages (`V_th = 0.6 V`), input (`V_in`), memory (`V_mem`), and output (`V_out`) voltages.
- **Trends**:
- `V_mem` transitions from 0.1 V to 0.3 V at ~0.8 ms, triggering `V_out` to rise sharply.
#### b) Expanded Circuit Diagram (Center)
- **Components**:
- Memory array (M1-M18) with voltage-controlled switches (`V_x`, `V_y`).
- Buffers (`M3`, `M4`), comparators (`M5`, `M6`), and output drivers (`M14`, `M18`).
- Labels: `V_in`, `V_buff`, `V_mem`, `V_out`, `V_th`.
#### d) CCDF Plot (Bottom-Left)
- **Axes**:
- X-axis: Conductance (G, μS), Y-axis: CCDF (Cumulative Distribution Function).
- Curves: 25, 50, 75, 100, 125 μS (colors: gray to pink).
- **Trends**:
- Steeper curves at lower G values indicate higher probability of low conductance states.
#### g) Box Plot (Bottom-Center)
- **Axes**:
- X-axis: Neuron Row ID (1-5), Y-axis: Peak Voltage (V).
- Data: Median voltages (0.1-0.3 V), interquartile ranges (0.05-0.15 V).
- **Trends**:
- Row 5 shows the highest median voltage (0.3 V), Row 1 the lowest (0.1 V).
#### h) Scatter Plot (Bottom-Right)
- **Axes**:
- X-axis: RRAM Conductance (μS), Y-axis: Output Frequency (kHz).
- Data: Blue (`V_th = 250 mV`), Green (`V_th = 300 mV`).
- **Trends**:
- Linear correlation: Higher conductance increases frequency (e.g., 125 μS → 90 kHz for 250 mV).
---
### Key Observations
1. **Voltage Dynamics (e, f)**: Lower conductance (G) results in slower voltage recovery, critical for timing precision in neuromorphic systems.
2. **Threshold Behavior (f)**: `V_mem` hysteresis (0.1 V → 0.3 V) suggests non-volatile memory retention.
3. **Conductance Distribution (d)**: Most devices cluster at 50-75 μS, with outliers at 25 μS (high leakage) and 125 μS (high retention).
4. **Neuron Variability (g)**: Row 5’s elevated voltage may indicate defective or optimized memory cells.
5. **Frequency-Scale Relationship (h)**: Conductance directly impacts operational speed, with 300 mV threshold enabling higher frequencies.
---
### Interpretation
The system demonstrates a voltage-controlled memory array with conductance-dependent timing characteristics. The CCDF plot (d) reveals a bimodal distribution of device performance, suggesting manufacturing variability. The box plot (g) highlights Row 5 as a potential outlier, warranting further inspection. The scatter plot (h) confirms that optimizing RRAM conductance and threshold voltage (`V_th`) is critical for achieving high-frequency operation. The circuit diagrams (a, b) illustrate a hierarchical architecture where memory cells (`M1-M18`) interface with logic gates (`M3-M6`) to process signals, with `V_th` acting as a critical control parameter. Experimental hardware (c) validates the system’s physical implementation, though thermal management (not shown) may affect real-world performance.