## Line Chart: Benchmark Average
### Overview
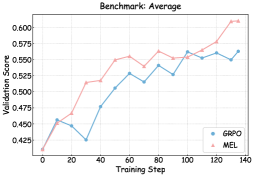
The image is a line chart comparing the validation scores of two methods, GRPO and MEL, over training steps. The chart shows how the validation score changes as the training progresses for each method.
### Components/Axes
* **Title:** Benchmark: Average
* **X-axis:** Training Step, ranging from 0 to 140 in increments of 20.
* **Y-axis:** Validation Score, ranging from 0.425 to 0.600.
* **Legend:** Located in the bottom-left corner.
* GRPO (blue line with circle markers)
* MEL (pink line with triangle markers)
### Detailed Analysis
* **GRPO (blue line):**
* Starts at approximately 0.41.
* Decreases to approximately 0.45 at step 10.
* Decreases to approximately 0.43 at step 20.
* Increases to approximately 0.48 at step 40.
* Increases to approximately 0.51 at step 50.
* Increases to approximately 0.53 at step 60.
* Decreases to approximately 0.52 at step 70.
* Increases to approximately 0.54 at step 80.
* Decreases to approximately 0.53 at step 90.
* Increases to approximately 0.56 at step 100.
* Decreases to approximately 0.55 at step 110.
* Increases to approximately 0.56 at step 120.
* Decreases to approximately 0.55 at step 130.
* Increases to approximately 0.56 at step 140.
* **MEL (pink line):**
* Starts at approximately 0.41.
* Increases to approximately 0.47 at step 20.
* Increases to approximately 0.51 at step 40.
* Increases to approximately 0.55 at step 50.
* Increases to approximately 0.56 at step 60.
* Decreases to approximately 0.54 at step 70.
* Increases to approximately 0.56 at step 80.
* Decreases to approximately 0.55 at step 90.
* Increases to approximately 0.56 at step 100.
* Increases to approximately 0.58 at step 120.
* Increases to approximately 0.61 at step 140.
### Key Observations
* Both GRPO and MEL start with similar validation scores.
* MEL generally outperforms GRPO after the initial training steps.
* MEL shows a more consistent upward trend, especially towards the end of the training.
* GRPO fluctuates more than MEL throughout the training process.
### Interpretation
The chart suggests that MEL is a more effective method for this particular benchmark, as it achieves higher validation scores and demonstrates a more stable and upward trend compared to GRPO. The fluctuations in GRPO's performance indicate that it might be more sensitive to the training process or require further optimization. The data implies that MEL converges to a better solution more consistently than GRPO.