\n
## Line Chart: Benchmark Average
### Overview
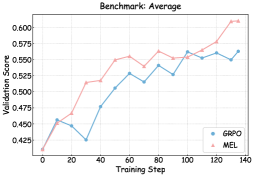
The image presents a line chart comparing the validation score of two models, GRP0 and MEL, across 140 training steps. The chart visualizes the performance of each model during the training process, showing how the validation score changes with each step.
### Components/Axes
* **Title:** "Benchmark: Average" - positioned at the top-center of the chart.
* **X-axis:** "Training Step" - ranging from 0 to 140, with tick marks at intervals of 20.
* **Y-axis:** "Validation Score" - ranging from approximately 0.42 to 0.62, with tick marks at intervals of 0.025.
* **Legend:** Located in the top-right corner of the chart.
* GRP0 - represented by a light blue line with circular markers.
* MEL - represented by a light red/pink line with triangular markers.
* **Gridlines:** Horizontal and vertical gridlines are present to aid in reading values.
### Detailed Analysis
**GRP0 (Light Blue Line):**
The GRP0 line generally slopes upward, indicating an increasing validation score over the training steps.
* At Training Step 0, the Validation Score is approximately 0.43.
* At Training Step 20, the Validation Score drops to approximately 0.38.
* At Training Step 40, the Validation Score rises to approximately 0.48.
* At Training Step 60, the Validation Score is approximately 0.53.
* At Training Step 80, the Validation Score dips to approximately 0.52.
* At Training Step 100, the Validation Score reaches approximately 0.56.
* At Training Step 120, the Validation Score is approximately 0.57.
* At Training Step 140, the Validation Score decreases to approximately 0.55.
**MEL (Light Red/Pink Line):**
The MEL line also generally slopes upward, but with more fluctuations.
* At Training Step 0, the Validation Score is approximately 0.32.
* At Training Step 20, the Validation Score rises to approximately 0.52.
* At Training Step 40, the Validation Score is approximately 0.55.
* At Training Step 60, the Validation Score is approximately 0.57.
* At Training Step 80, the Validation Score dips to approximately 0.53.
* At Training Step 100, the Validation Score rises to approximately 0.56.
* At Training Step 120, the Validation Score is approximately 0.59.
* At Training Step 140, the Validation Score reaches approximately 0.61.
### Key Observations
* The MEL model consistently achieves higher validation scores than the GRP0 model throughout the training process.
* Both models exhibit some degree of fluctuation in their validation scores, suggesting that the training process is not perfectly smooth.
* The GRP0 model experiences a significant drop in validation score at Training Step 20, followed by a recovery.
* The MEL model shows a more consistent upward trend, with smaller fluctuations.
* Both models appear to be converging towards a stable validation score as the training progresses, but the MEL model is still improving at the final step.
### Interpretation
The chart demonstrates the learning curves of two models, GRP0 and MEL, during a training process. The validation score serves as a metric for evaluating the model's performance on unseen data. The consistently higher validation scores of the MEL model suggest that it is a better-performing model than GRP0, at least for this benchmark. The fluctuations in the validation scores indicate that the training process is sensitive to the specific training data and that further optimization may be possible. The convergence of the learning curves towards the end of the training process suggests that both models are approaching their maximum performance potential. The initial dip in GRP0's performance could be due to a challenging initial batch of data or a learning rate adjustment. The continued improvement of MEL at the final step suggests that it may benefit from further training.