## Diagram: Graphical Representation of Utility Dependence Structures
### Overview
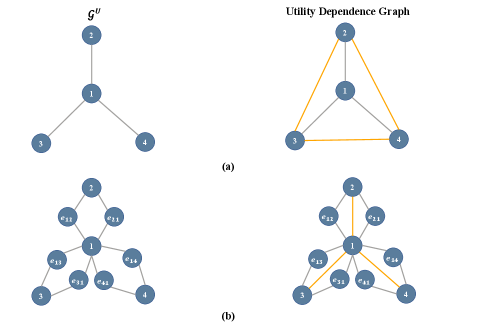
The image contains two diagrams labeled (a) and (b), illustrating hierarchical relationships between nodes in a utility dependence framework. Diagram (a) shows a simplified graph structure, while diagram (b) expands nodes into sub-nodes to represent granular dependencies.
### Components/Axes
- **Nodes**:
- Diagram (a): Labeled `1`, `2`, `3`, `4`.
- Diagram (b): Sub-nodes labeled `e11`, `e12`, `e13`, `e14` (for node `1`); `e21`, `e22` (for node `2`); `e31`, `e32`, `e33` (for node `3`); `e41`, `e42`, `e43`, `e44` (for node `4`).
- **Edges**:
- Diagram (a): Solid lines represent connections.
- Diagram (b): Edges labeled with sub-node pairs (e.g., `e11-e21`, `e31-e41`).
- **Labels**:
- "Utility Dependence Graph" is explicitly labeled in diagram (a).
- Sub-node labels in diagram (b) follow the format `eXY`, where `X` is the original node and `Y` is a sub-node identifier.
### Detailed Analysis
#### Diagram (a)
- **Original Graph (`G^U`)**:
- Node `1` is connected to nodes `2`, `3`, and `4` (star topology).
- **Utility Dependence Graph**:
- Forms a triangle with additional edges:
- Edges: `1-2`, `1-3`, `1-4`, `2-3`, `3-4`.
- Missing edge: `2-4`.
#### Diagram (b)
- **Expanded Sub-Nodes**:
- Each original node splits into sub-nodes (e.g., node `1` → `e11`, `e12`, `e13`, `e14`).
- **Utility Dependence Edges**:
- Mapped from diagram (a) to sub-node pairs:
- `1-2` → `e11-e21`
- `1-3` → `e11-e31`
- `1-4` → `e11-e41`
- `2-3` → `e21-e31`
- `3-4` → `e31-e41`
### Key Observations
1. **Hierarchical Structure**: Diagram (b) decomposes the original graph into sub-nodes, preserving dependency relationships at a finer granularity.
2. **Edge Consistency**: Edges in diagram (b) directly correspond to those in diagram (a), maintaining structural integrity.
3. **Missing Edge**: The absence of `2-4` in diagram (a) is retained in diagram (b) as no edge connects `e21` to `e41`.
### Interpretation
This diagram illustrates a **dependency hierarchy** where:
- The original graph (`G^U`) represents high-level utility dependencies (e.g., node `1` as a central hub).
- The expanded sub-nodes in diagram (b) model granular dependencies (e.g., `e11-e21` as a specific sub-dependency of `1-2`).
- The missing `2-4` edge suggests an intentional exclusion of direct dependency between nodes `2` and `4`, possibly indicating a design constraint or system limitation.
The structure implies a **modular system** where dependencies are both centralized (via node `1`) and distributed (via sub-node connections). This could apply to network topologies, resource allocation models, or dependency graphs in software engineering.