## Heatmap Comparison: Ground Truth vs. Reconstructed Signals Across Frequencies
### Overview
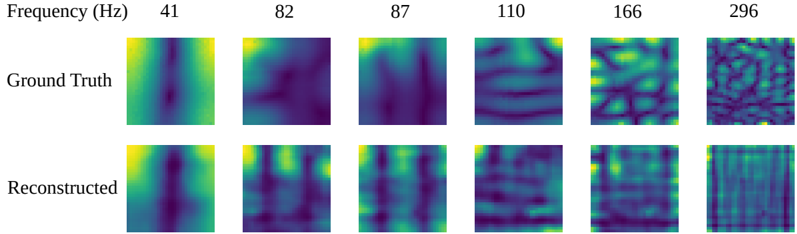
The image presents a side-by-side comparison of "Ground Truth" and "Reconstructed" heatmaps across six distinct frequencies (41 Hz to 296 Hz). Each heatmap uses a color gradient (blue to yellow) to represent intensity or signal strength, with darker blue indicating lower values and brighter yellow indicating higher values. The comparison highlights differences in pattern fidelity between the original (Ground Truth) and reconstructed signals.
### Components/Axes
- **X-axis (Columns)**: Frequencies (Hz): 41, 82, 87, 110, 166, 296.
- **Y-axis (Rows)**: Two categories:
- Top row: "Ground Truth" (original data).
- Bottom row: "Reconstructed" (algorithmic approximation).
- **Color Scale**: Blue (low intensity) to Yellow (high intensity). No explicit legend is provided, but the gradient is consistent across all images.
### Detailed Analysis
#### Frequency 41 Hz
- **Ground Truth**: A vertical dark blue line dominates the center, with faint yellow gradients at the edges.
- **Reconstructed**: The vertical line is less distinct, with broader yellow regions and reduced contrast.
#### Frequency 82 Hz
- **Ground Truth**: A diagonal dark blue line spans from top-left to bottom-right, with scattered yellow patches.
- **Reconstructed**: The diagonal line is fragmented, with additional yellow noise and reduced sharpness.
#### Frequency 87 Hz
- **Ground Truth**: Multiple intersecting dark blue lines form a complex, irregular pattern.
- **Reconstructed**: The pattern is blurred, with overlapping yellow regions obscuring the original structure.
#### Frequency 110 Hz
- **Ground Truth**: Horizontal dark blue lines with periodic yellow bands.
- **Reconstructed**: Lines are less uniform, with increased yellow noise and irregular spacing.
#### Frequency 166 Hz
- **Ground Truth**: A grid-like structure with intersecting dark blue lines and localized yellow spots.
- **Reconstructed**: The grid is distorted, with yellow regions dominating and blue lines appearing fragmented.
#### Frequency 296 Hz
- **Ground Truth**: Dense, chaotic dark blue patterns with minimal yellow areas.
- **Reconstructed**: Highly noisy, with uniform yellow regions and no discernible blue patterns.
### Key Observations
1. **Fidelity Degradation**: Reconstructed images lose detail and contrast compared to Ground Truth, especially at higher frequencies (166 Hz and 296 Hz).
2. **Pattern Complexity**: Ground Truth patterns become increasingly intricate with higher frequencies, while reconstructed versions simplify or distort them.
3. **Noise Introduction**: Reconstructed images at 296 Hz exhibit excessive yellow noise, suggesting algorithmic limitations in handling high-frequency components.
4. **Color Consistency**: The blue-to-yellow gradient is uniform across all images, but reconstructed versions often overrepresent yellow (high-intensity) areas.
### Interpretation
The data suggests that the reconstruction algorithm performs well at lower frequencies (41–87 Hz) but struggles with higher frequencies (110 Hz and above). This could indicate:
- **Resolution Limitations**: The algorithm may lack the capacity to resolve fine details at high frequencies.
- **Noise Amplification**: High-frequency components are either omitted or misrepresented, leading to artificial yellow noise.
- **Signal Prioritization**: The reconstruction prioritizes lower-frequency patterns, sacrificing accuracy for higher-frequency fidelity.
The comparison underscores the challenges of signal reconstruction in preserving high-frequency details, which may have implications for applications like audio processing, medical imaging, or spectral analysis where frequency-specific accuracy is critical.