## Causal Diagram: Targeted Modeling Principle
### Overview
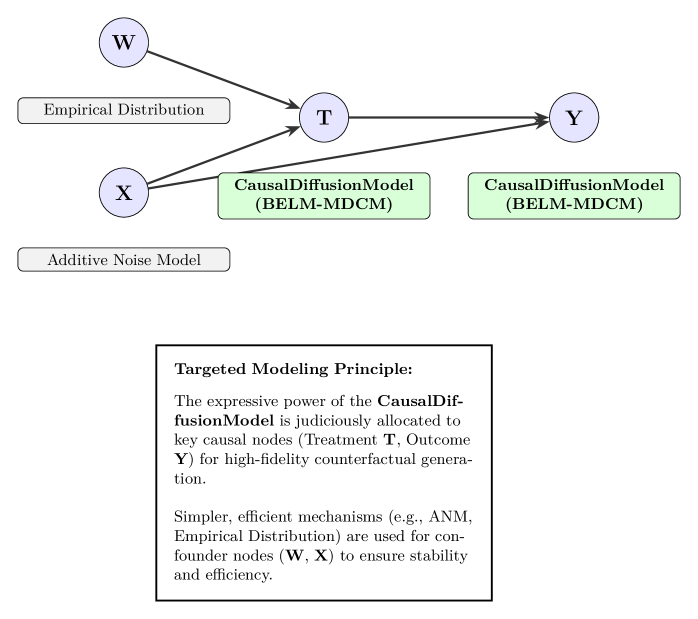
The image presents a causal diagram illustrating the Targeted Modeling Principle. It shows relationships between variables W, X, T, and Y, with specific modeling approaches applied to different nodes. The diagram is accompanied by a text box explaining the principle.
### Components/Axes
* **Nodes:**
* W (top-left): Represented by a blue circle.
* X (bottom-left): Represented by a blue circle.
* T (center): Represented by a blue circle.
* Y (right): Represented by a blue circle.
* **Edges:** Arrows indicating causal relationships.
* W -> T
* X -> T
* T -> Y
* X -> Y
* **Annotations:**
* "Empirical Distribution": Associated with node W, enclosed in a rounded rectangle.
* "Additive Noise Model": Associated with node X, enclosed in a rounded rectangle.
* "CausalDiffusionModel (BELM-MDCM)": Associated with the edges X -> Y and T -> Y, enclosed in green rounded rectangles.
* **Text Box (bottom):** Contains the "Targeted Modeling Principle" description.
### Detailed Analysis or ### Content Details
**Diagram Structure:**
* Node W (Empirical Distribution) points to Node T.
* Node X (Additive Noise Model) points to Node T and Node Y.
* Node T points to Node Y.
* The edges T -> Y and X -> Y are annotated with "CausalDiffusionModel (BELM-MDCM)".
**Text Box Content:**
"Targeted Modeling Principle:
The expressive power of the CausalDiffusionModel is judiciously allocated to key causal nodes (Treatment T, Outcome Y) for high-fidelity counterfactual generation.
Simpler, efficient mechanisms (e.g., ANM, Empirical Distribution) are used for confounder nodes (W, X) to ensure stability and efficiency."
### Key Observations
* The CausalDiffusionModel (BELM-MDCM) is specifically applied to model the relationships leading to the outcome variable Y.
* Simpler models (Empirical Distribution, Additive Noise Model) are used for the confounder nodes W and X.
* The diagram visually represents the principle of allocating complex models to key causal nodes and simpler models to confounder nodes.
### Interpretation
The diagram and text describe a targeted modeling approach where the complexity of the model is tailored to the importance of the causal node. The CausalDiffusionModel, presumably a more complex and expressive model, is used to model the treatment (T) and outcome (Y) variables, which are crucial for counterfactual generation. Simpler models like Empirical Distribution and Additive Noise Model are used for the confounder variables (W and X) to ensure stability and efficiency. This suggests a strategy to balance model accuracy and computational cost by focusing the modeling effort on the most critical parts of the causal structure.