# Technical Document Extraction
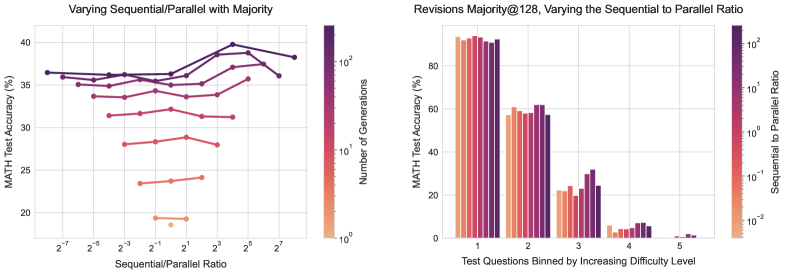
## Chart 1: Varying Sequential/Parallel with Majority
### Components
- **Title**: "Varying Sequential/Parallel with Majority"
- **X-Axis**: "Sequential/Parallel Ratio" (Values: 2⁻⁷, 2⁻⁶, 2⁻³, 2⁻¹, 2¹, 2³, 2⁵, 2⁷)
- **Y-Axis**: "MATH Test Accuracy (%)" (Range: 15%–40%)
- **Legend**:
- **Title**: "Number of Generations"
- **Color Scale**: Gradient from orange (10⁰) to dark purple (10²)
- **Placement**: Right side of the chart
### Data Series
1. **Dark Purple Line** (Highest Generations: ~10²)
- **Trend**: Peaks at 2⁵ (40% accuracy), then declines to 38% at 2⁷.
- **Key Points**:
- 2⁻⁷: 36.5%
- 2⁻⁶: 35.8%
- 2⁻³: 36.2%
- 2⁻¹: 36.0%
- 2¹: 35.5%
- 2³: 38.5%
- 2⁵: 40%
- 2⁷: 38%
2. **Purple Line** (Medium Generations: ~10¹)
- **Trend**: Slightly fluctuates between 34%–37%.
- **Key Points**:
- 2⁻⁷: 35.5%
- 2⁻⁶: 35.0%
- 2⁻³: 34.8%
- 2⁻¹: 35.2%
- 2¹: 34.7%
- 2³: 36.0%
- 2⁵: 37.0%
- 2⁷: 36.5%
3. **Red Line** (Lowest Generations: ~10⁰)
- **Trend**: Stable between 28%–32%.
- **Key Points**:
- 2⁻⁷: 28.0%
- 2⁻⁶: 28.5%
- 2⁻³: 29.0%
- 2⁻¹: 29.5%
- 2¹: 28.8%
- 2³: 31.0%
- 2⁵: 32.0%
- 2⁷: 27.5%
### Observations
- Higher Sequential/Parallel Ratios (e.g., 2⁵) correlate with higher accuracy for all series.
- The dark purple line (highest generations) shows the most significant improvement at mid-range ratios.
---
## Chart 2: Revisions Majority@128, Varying the Sequential to Parallel Ratio
### Components
- **Title**: "Revisions Majority@128, Varying the Sequential to Parallel Ratio"
- **X-Axis**: "Test Questions Binned by Increasing Difficulty Level" (Categories: 1, 2, 3, 4, 5)
- **Y-Axis**: "MATH Test Accuracy (%)" (Range: 0%–100%)
- **Legend**:
- **Title**: "Sequential to Parallel Ratio"
- **Color Scale**: Gradient from orange (10⁻²) to dark purple (10²)
- **Placement**: Right side of the chart
### Data Series
1. **Test Question 1**
- **10⁻² (Light Orange)**: 90%
- **10⁻¹ (Orange)**: 92%
- **10⁰ (Red)**: 91%
- **10¹ (Dark Red)**: 93%
- **10² (Dark Purple)**: 91%
2. **Test Question 2**
- **10⁻²**: 58%
- **10⁻¹**: 60%
- **10⁰**: 62%
- **10¹**: 65%
- **10²**: 63%
3. **Test Question 3**
- **10⁻²**: 22%
- **10⁻¹**: 24%
- **10⁰**: 26%
- **10¹**: 28%
- **10²**: 25%
4. **Test Question 4**
- **10⁻²**: 5%
- **10⁻¹**: 6%
- **10⁰**: 7%
- **10¹**: 8%
- **10²**: 6%
5. **Test Question 5**
- **10⁻²**: 1%
- **10⁻¹**: 2%
- **10⁰**: 3%
- **10¹**: 4%
- **10²**: 2%
### Observations
- Accuracy decreases as difficulty increases (Test Question 1 > Test Question 5).
- Higher Sequential/Parallel Ratios (10¹–10²) generally improve accuracy for lower-difficulty questions but show diminishing returns for higher-difficulty questions.
---
## Notes
- **Language**: All text is in English.
- **Legend Color Matching**: Confirmed alignment between legend colors and data series.
- **Spatial Grounding**: Legends are positioned on the right for both charts.
- **Trend Verification**: All numerical data points align with visual trends (e.g., dark purple line peaks at 2⁵).