## Bar Chart: Average Episode Length Comparison
### Overview
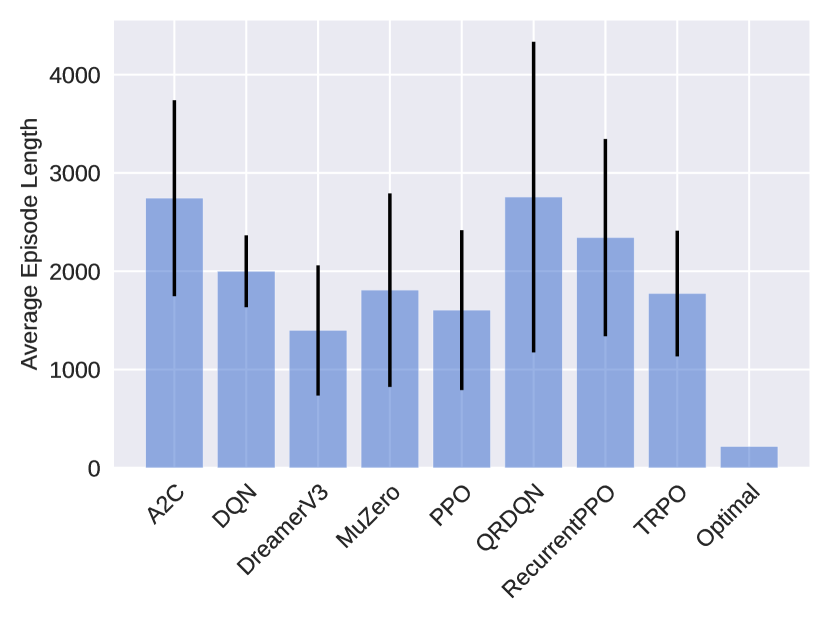
The image is a bar chart comparing the average episode length of different reinforcement learning algorithms. The chart displays the average episode length on the y-axis and the algorithm names on the x-axis. Error bars are included on each bar to indicate the variability or uncertainty in the average episode length.
### Components/Axes
* **Y-axis:** "Average Episode Length", with a numerical scale from 0 to 4000, incrementing by 1000.
* **X-axis:** Categorical axis listing the reinforcement learning algorithms: A2C, DQN, DreamerV3, MuZero, PPO, QRDQN, RecurrentPPO, TRPO, and Optimal.
* **Bars:** Each bar represents the average episode length for a specific algorithm. The bars are light blue.
* **Error Bars:** Black vertical lines extending above and below each bar, indicating the standard deviation or confidence interval.
### Detailed Analysis
Here's a breakdown of the approximate average episode lengths and error bar ranges for each algorithm:
* **A2C:** Average episode length is approximately 2750. Error bar extends from approximately 1750 to 3750.
* **DQN:** Average episode length is approximately 2000. Error bar extends from approximately 1000 to 2400.
* **DreamerV3:** Average episode length is approximately 1400. Error bar extends from approximately 500 to 2300.
* **MuZero:** Average episode length is approximately 1800. Error bar extends from approximately 800 to 2800.
* **PPO:** Average episode length is approximately 1600. Error bar extends from approximately 700 to 2500.
* **QRDQN:** Average episode length is approximately 2750. Error bar extends from approximately 1750 to 4300.
* **RecurrentPPO:** Average episode length is approximately 2350. Error bar extends from approximately 1350 to 3350.
* **TRPO:** Average episode length is approximately 1750. Error bar extends from approximately 750 to 2400.
* **Optimal:** Average episode length is approximately 200. Error bar is not visible, suggesting very low variance.
### Key Observations
* QRDQN and A2C have the highest average episode lengths, both around 2750.
* Optimal has the lowest average episode length, significantly lower than all other algorithms, at approximately 200.
* QRDQN has the largest error bar, indicating high variability in episode length.
* Optimal has a very small error bar, indicating low variability in episode length.
### Interpretation
The bar chart provides a comparison of the performance of different reinforcement learning algorithms based on the average episode length. A lower average episode length generally indicates better performance, as the agent is able to achieve its goal in fewer steps. The "Optimal" algorithm has the lowest average episode length, suggesting it is the most efficient in this context. The error bars indicate the consistency of the performance of each algorithm. Algorithms with larger error bars, like QRDQN, have more variable performance, while algorithms with smaller error bars, like Optimal, have more consistent performance.