\n
## Bar Chart: Average Episode Length by Algorithm
### Overview
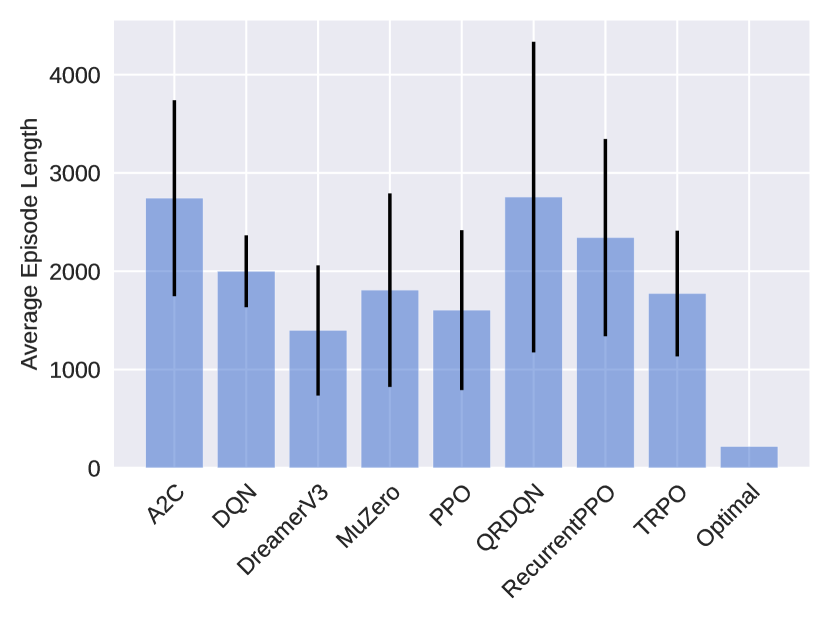
The image presents a bar chart comparing the average episode length achieved by different reinforcement learning algorithms. Each bar represents an algorithm, and the height of the bar indicates the average episode length. Error bars are included on top of each bar, representing the variability or standard deviation of the results.
### Components/Axes
* **X-axis:** Algorithm Name (A2C, DQN, DreamerV3, MuZero, PPO, QRDDQN, RecurrentPPO, TRPO, Optimal)
* **Y-axis:** Average Episode Length (Scale from 0 to 4000, increments of 1000)
* **Bars:** Represent the average episode length for each algorithm. The bars are light blue.
* **Error Bars:** Black vertical lines extending above and below each bar, indicating the variability of the results.
### Detailed Analysis
The chart displays the following approximate values (read from the bar heights and error bar endpoints):
* **A2C:** Average Episode Length ≈ 2600. Error bar extends from approximately 1700 to 3500.
* **DQN:** Average Episode Length ≈ 1800. Error bar extends from approximately 1000 to 2600.
* **DreamerV3:** Average Episode Length ≈ 1500. Error bar extends from approximately 800 to 2200.
* **MuZero:** Average Episode Length ≈ 1300. Error bar extends from approximately 600 to 2000.
* **PPO:** Average Episode Length ≈ 2800. Error bar extends from approximately 1800 to 3800.
* **QRDDQN:** Average Episode Length ≈ 2500. Error bar extends from approximately 1500 to 3500.
* **RecurrentPPO:** Average Episode Length ≈ 2300. Error bar extends from approximately 1300 to 3300.
* **TRPO:** Average Episode Length ≈ 1900. Error bar extends from approximately 1000 to 2800.
* **Optimal:** Average Episode Length ≈ 300. Error bar extends from approximately 0 to 600.
The bars for A2C, PPO, QRDDQN, and RecurrentPPO are relatively tall, indicating higher average episode lengths. DreamerV3 and MuZero have lower average episode lengths. The "Optimal" algorithm has a significantly lower average episode length than all other algorithms. The error bars show considerable variability in the results for all algorithms.
### Key Observations
* The "Optimal" algorithm achieves a significantly shorter average episode length compared to all other algorithms.
* A2C and PPO exhibit the highest average episode lengths.
* There is substantial variability in the results for each algorithm, as indicated by the large error bars.
* The algorithms cluster into two groups: those with average episode lengths around 1300-2000 and those with average episode lengths around 2300-2800.
### Interpretation
The chart suggests that the reinforcement learning algorithms tested differ significantly in their ability to sustain episodes. A longer episode length could indicate better performance in a given environment, but it depends on the specific task and reward structure. The "Optimal" algorithm's short episode length might indicate a rapid completion of the task or a different strategy altogether. The large error bars suggest that the performance of each algorithm is sensitive to factors such as random initialization, hyperparameter settings, or environmental variations. The clustering of algorithms into two groups suggests that there may be distinct approaches to solving the problem, with some algorithms consistently achieving longer episode lengths than others. Further investigation would be needed to understand the underlying reasons for these differences and to determine which algorithm is most suitable for a particular application. The chart provides a comparative overview of the algorithms' performance, but it does not reveal the specific mechanisms driving these results.