## Bar Chart: Average Episode Length Comparison Across Algorithms
### Overview
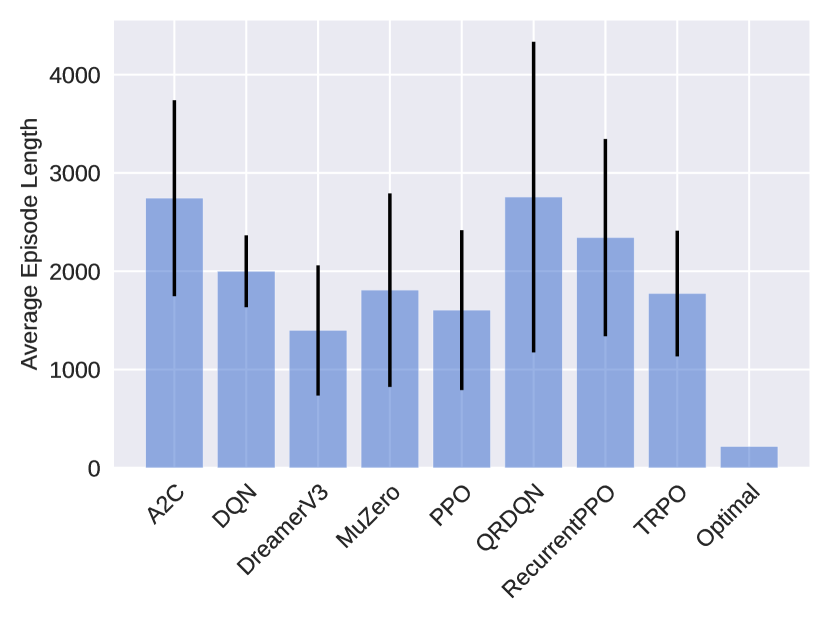
The chart compares the average episode length of nine different algorithms (A2C, DQN, DreamerV3, MuZero, PPO, QRDQN, RecurrentPPO, TRPO, and Optimal) using vertical bars with error bars. The y-axis represents "Average Episode Length" in arbitrary units, while the x-axis lists algorithm names. Error bars indicate variability in measurements.
### Components/Axes
- **X-axis**: Algorithm names (A2C, DQN, DreamerV3, MuZero, PPO, QRDQN, RecurrentPPO, TRPO, Optimal).
- **Y-axis**: "Average Episode Length" (units unspecified, scale from 0 to 4000).
- **Error Bars**: Black vertical lines extending above/below bars, representing measurement uncertainty.
- **Legend**: Absent.
### Detailed Analysis
1. **A2C**: Bar height ~2800, error bar spans ~1800–3800.
2. **DQN**: Bar height ~2000, error bar spans ~1500–2500.
3. **DreamerV3**: Bar height ~1400, error bar spans ~800–2000.
4. **MuZero**: Bar height ~1800, error bar spans ~1000–2800.
5. **PPO**: Bar height ~1600, error bar spans ~1200–2400.
6. **QRDQN**: Bar height ~2800, error bar spans ~1200–4400 (longest error bar).
7. **RecurrentPPO**: Bar height ~2300, error bar spans ~1500–3400.
8. **TRPO**: Bar height ~1800, error bar spans ~1200–2400.
9. **Optimal**: Bar height ~200, error bar spans ~100–300 (smallest bar).
### Key Observations
- **Optimal** has the shortest average episode length (~200), suggesting superior efficiency.
- **QRDQN** has the highest average (~2800) but also the largest error bar (~1200–4400), indicating high variability.
- **A2C** and **QRDQN** share the tallest bars, but A2C’s error bar is narrower.
- **DreamerV3** has the second-lowest average (~1400) and a wide error range (~800–2000).
- **RecurrentPPO** and **TRPO** show moderate averages (~2300 and ~1800) with mid-sized error bars.
### Interpretation
The chart highlights trade-offs between average performance and consistency across algorithms. **Optimal** stands out as the most efficient, with a low average and small error margin. **QRDQN** and **A2C** achieve high averages but exhibit significant variability, with QRDQN’s error bar nearly doubling its average. Algorithms like **DreamerV3** and **MuZero** show lower averages but inconsistent performance. The absence of a legend suggests the chart assumes prior knowledge of algorithm identities. The data implies that efficiency (Optimal) and stability (A2C) are distinct traits, with no single algorithm dominating both metrics.