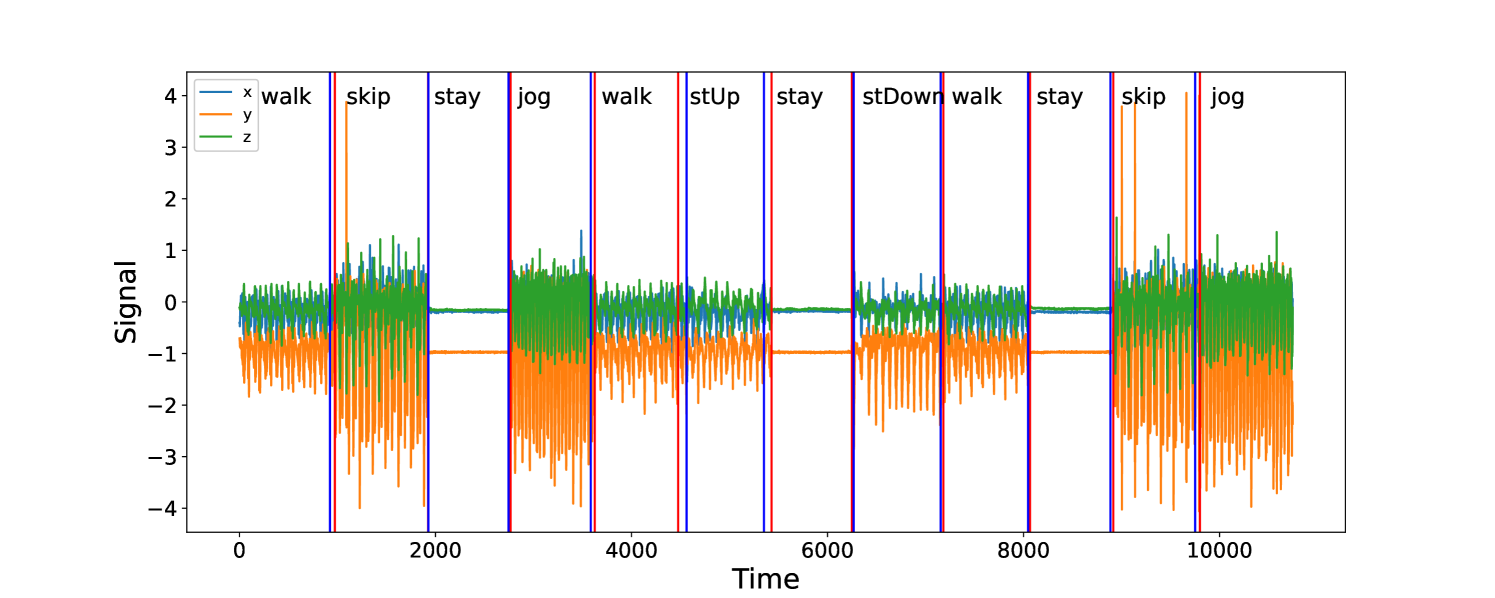
## Time Series Chart: Signal Data for Various Activities
### Overview
The image is a time series chart displaying signal data across three dimensions (x, y, and z) over time. The chart visualizes how these signals change during different activities such as walking, skipping, staying, jogging, standing up (stUp), and standing down (stDown). Vertical lines mark the transitions between these activities.
### Components/Axes
* **X-axis (Horizontal):** "Time" ranging from 0 to 10000. Axis markers are present at intervals of 2000 (0, 2000, 4000, 6000, 8000, 10000).
* **Y-axis (Vertical):** "Signal" ranging from -4 to 4. Axis markers are present at intervals of 1 (-4, -3, -2, -1, 0, 1, 2, 3, 4).
* **Legend (Top-Left):**
* Blue line: "x walk"
* Orange line: "y"
* Green line: "z"
* **Vertical Lines:** Indicate transitions between activities. The activities are labeled above the chart, aligned with the corresponding vertical lines.
* Blue lines: skip, jog, walk, stay, skip, jog
* Red lines: stUp, stDown
* Purple lines: stay, stay, stay
### Detailed Analysis
The chart displays three data series (x, y, and z) over time, with vertical lines indicating different activities.
* **x walk (Blue):** The blue line represents the "x walk" signal. It generally fluctuates around 0, with some spikes during walking and jogging activities.
* **y (Orange):** The orange line represents the "y" signal. It shows significant fluctuations, particularly during jogging and skipping activities, where it oscillates between approximately -3 and 4. During "stay" periods, the y signal is approximately -1.
* **z (Green):** The green line represents the "z" signal. It remains relatively stable around 0 during "stay" periods. It shows some fluctuations during walking, jogging, and skipping activities, but less extreme than the "y" signal.
**Activity-Specific Observations:**
* **Walk:** The "x walk" signal (blue) shows moderate fluctuations. The "y" signal (orange) oscillates between approximately -2 and 1. The "z" signal (green) shows moderate fluctuations.
* **Skip:** The "y" signal (orange) shows large oscillations between approximately -3 and 4. The "x walk" signal (blue) and "z" signal (green) also show fluctuations.
* **Stay:** All three signals ("x walk," "y," and "z") are relatively stable. The "y" signal (orange) is approximately -1.
* **Jog:** The "y" signal (orange) shows large oscillations between approximately -3 and 4. The "x walk" signal (blue) and "z" signal (green) also show fluctuations.
* **stUp (Stand Up):** The "y" signal (orange) shows a sharp spike upward.
* **stDown (Stand Down):** The "y" signal (orange) shows a sharp spike downward.
### Key Observations
* The "y" signal (orange) is the most sensitive to changes in activity, showing large oscillations during dynamic activities like jogging and skipping.
* The "z" signal (green) is relatively stable, especially during "stay" periods.
* The vertical lines accurately mark the transitions between different activities.
* The "stUp" and "stDown" activities are characterized by sharp spikes in the "y" signal (orange).
### Interpretation
The chart provides a clear visualization of how different activities affect the signal data in three dimensions. The "y" signal appears to be the most indicative of movement and activity intensity. The "stay" periods are characterized by stable signals, particularly in the "z" dimension. The spikes during "stUp" and "stDown" suggest a rapid change in the "y" dimension during these transitions. The data suggests that these signals could be used to classify or recognize different activities based on their unique signal patterns.