TECHNICAL ASSET FINGERPRINT
3be00e4a0935097c8764ace4
Click to view fullscreen
Press ESC or click to close
FOUND IN PAPERS
EXPERT: gemini-2.5-flash-lite-free VERSION 1
RUNTIME: google-free/gemini-2.5-flash-lite
INTEL_VERIFIED
## Line Chart: Activity Signal Over Time
### Overview
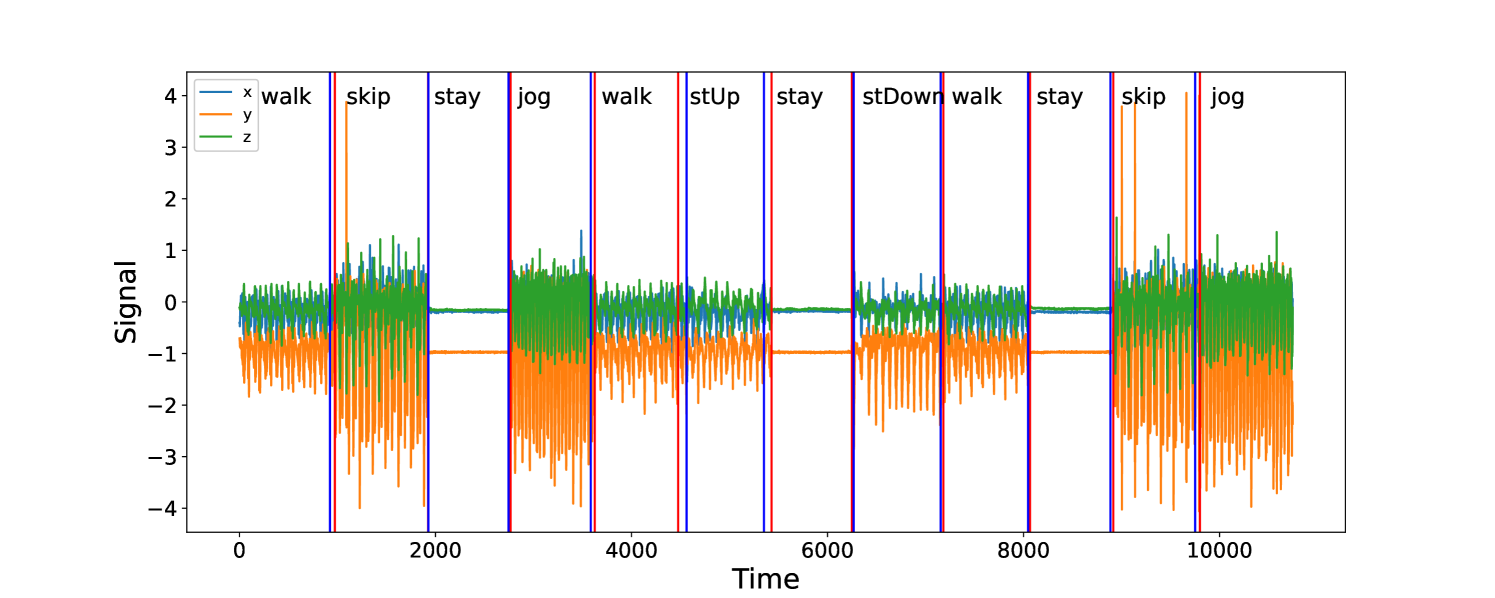
This image displays a line chart showing sensor signals (labeled 'x', 'y', and 'z') over time. The chart is segmented by vertical lines, each indicating a different human activity. The activities are labeled above the corresponding time segments.
### Components/Axes
* **X-axis:** Labeled "Time". The axis ranges from approximately 0 to 11000. Major tick marks are present at 0, 2000, 4000, 6000, 8000, and 10000.
* **Y-axis:** Labeled "Signal". The axis ranges from -4 to 4. Major tick marks are present at -4, -3, -2, -1, 0, 1, 2, 3, and 4.
* **Legend:** Located in the top-left corner of the chart. It indicates the color mapping for the three signal lines:
* 'x': Blue line
* 'y': Orange line
* 'z': Green line
* **Activity Labels:** Text labels are positioned above the chart, indicating the type of activity occurring within specific time intervals. These labels are: "walk", "skip", "stay", "jog", "walk", "stUp", "stay", "stDown", "walk", "stay", "skip", "jog".
* **Vertical Dividers:** Red and blue vertical lines segment the chart, visually separating the different activity periods.
### Detailed Analysis or Content Details
The chart displays three distinct signal lines (blue for 'x', orange for 'y', and green for 'z') that fluctuate over time. The amplitude and pattern of these fluctuations vary significantly depending on the activity.
**Activity Segments and Signal Characteristics:**
1. **walk (approx. Time 0 to 1500):**
* 'x' (blue): Exhibits moderate oscillations, generally between -0.5 and 0.5.
* 'y' (orange): Shows strong, regular oscillations, ranging from approximately -1.5 to -0.5.
* 'z' (green): Displays smaller, more frequent oscillations, mostly between 0 and 0.5.
2. **skip (approx. Time 1500 to 2200):**
* 'x' (blue): Becomes more erratic with larger amplitude spikes, reaching up to 1.5.
* 'y' (orange): Shows very high amplitude, regular oscillations, ranging from approximately -3.5 to -1.5.
* 'z' (green): Exhibits high amplitude, regular oscillations, ranging from approximately 0.5 to 1.5.
3. **stay (approx. Time 2200 to 3000):**
* 'x' (blue): Signal is relatively flat, oscillating slightly around 0, with values between -0.2 and 0.2.
* 'y' (orange): Signal is very flat, close to -1, with minimal fluctuation.
* 'z' (green): Signal is relatively flat, oscillating slightly around 0.2, with values between 0 and 0.4.
4. **jog (approx. Time 3000 to 3800):**
* 'x' (blue): Shows moderate, somewhat regular oscillations, ranging from approximately -0.5 to 0.5.
* 'y' (orange): Exhibits strong, regular oscillations, ranging from approximately -2.5 to -0.5.
* 'z' (green): Displays moderate to high amplitude, regular oscillations, ranging from approximately 0 to 1.5.
5. **walk (approx. Time 3800 to 4500):**
* 'x' (blue): Similar to the first "walk" segment, with oscillations between -0.5 and 0.5.
* 'y' (orange): Similar to the first "walk" segment, with oscillations between -1.5 and -0.5.
* 'z' (green): Similar to the first "walk" segment, with oscillations between 0 and 0.5.
6. **stUp (approx. Time 4500 to 5200):**
* 'x' (blue): Shows a gradual increase in signal, peaking around 1.5, then returning to near 0.
* 'y' (orange): Exhibits a sharp drop to approximately -1, then a gradual rise back to near -0.5.
* 'z' (green): Shows a gradual increase, peaking around 0.5, then returning to near 0.
7. **stay (approx. Time 5200 to 6000):**
* 'x' (blue): Signal is relatively flat, oscillating slightly around 0, with values between -0.2 and 0.2.
* 'y' (orange): Signal is very flat, close to -1, with minimal fluctuation.
* 'z' (green): Signal is relatively flat, oscillating slightly around 0.2, with values between 0 and 0.4.
8. **stDown (approx. Time 6000 to 6800):**
* 'x' (blue): Shows a gradual decrease in signal, reaching a minimum around -1.5, then returning to near 0.
* 'y' (orange): Exhibits a sharp rise to approximately 0.5, then a gradual drop back to near -0.5.
* 'z' (green): Shows a gradual decrease, reaching a minimum around -0.5, then returning to near 0.
9. **walk (approx. Time 6800 to 7500):**
* 'x' (blue): Similar to previous "walk" segments, with oscillations between -0.5 and 0.5.
* 'y' (orange): Similar to previous "walk" segments, with oscillations between -1.5 and -0.5.
* 'z' (green): Similar to previous "walk" segments, with oscillations between 0 and 0.5.
10. **stay (approx. Time 7500 to 8200):**
* 'x' (blue): Signal is relatively flat, oscillating slightly around 0, with values between -0.2 and 0.2.
* 'y' (orange): Signal is very flat, close to -1, with minimal fluctuation.
* 'z' (green): Signal is relatively flat, oscillating slightly around 0.2, with values between 0 and 0.4.
11. **skip (approx. Time 8200 to 9000):**
* 'x' (blue): Exhibits high amplitude spikes, similar to the first "skip" segment.
* 'y' (orange): Shows very high amplitude, regular oscillations, similar to the first "skip" segment.
* 'z' (green): Displays high amplitude, regular oscillations, similar to the first "skip" segment.
12. **jog (approx. Time 9000 to 10500):**
* 'x' (blue): Shows moderate, somewhat regular oscillations, similar to the first "jog" segment.
* 'y' (orange): Exhibits strong, regular oscillations, similar to the first "jog" segment.
* 'z' (green): Displays moderate to high amplitude, regular oscillations, similar to the first "jog" segment.
### Key Observations
* **Distinct Activity Signatures:** Each activity (walk, skip, stay, jog, stUp, stDown) has a unique and recognizable pattern in the 'x', 'y', and 'z' signals.
* **"Stay" Activity:** Characterized by very low signal variance across all three axes, indicating minimal movement. The 'y' signal is consistently around -1, while 'x' and 'z' are close to 0.
* **"Skip" and "Jog" Activities:** Show the highest signal amplitudes, particularly in the 'y' and 'z' signals, indicating vigorous movement. "Skip" appears to have slightly higher peak amplitudes than "jog".
* **"Walk" Activity:** Exhibits moderate signal amplitudes, with distinct oscillatory patterns.
* **Vertical Transitions:** The transitions between activities are marked by abrupt changes in signal patterns, especially when moving from "stay" to a more active state or vice-versa.
* **"stUp" and "stDown" Activities:** These activities show more gradual changes in signal compared to the abrupt shifts between other activities, suggesting a controlled movement. "stUp" shows an overall increase in 'x' and 'z' signals and a decrease in 'y', while "stDown" shows the opposite trend.
### Interpretation
This chart demonstrates the effectiveness of using multi-axis sensor data (likely from an accelerometer or gyroscope) to differentiate between various human physical activities. The distinct patterns observed for each activity suggest that these signals can be used as features for activity recognition algorithms.
The "stay" periods serve as a baseline, showing minimal signal noise, while more dynamic activities like "skip" and "jog" generate significant signal variations. The "walk" pattern is a moderate intermediate. The "stUp" and "stDown" segments are particularly interesting as they show a directional change in the signals, which could be indicative of changes in body orientation or acceleration due to gravity.
The clear segmentation and labeling of activities allow for a direct correlation between the sensor readings and the physical actions performed. This type of data is crucial for applications such as wearable health trackers, sports performance analysis, and human-computer interaction. The consistency of patterns for repeated activities (e.g., multiple "walk" segments) suggests the reliability of the sensor data and the distinctiveness of the activities.
DECODING INTELLIGENCE...