# Technical Document Extraction: Signal Analysis Over Time
## Image Description
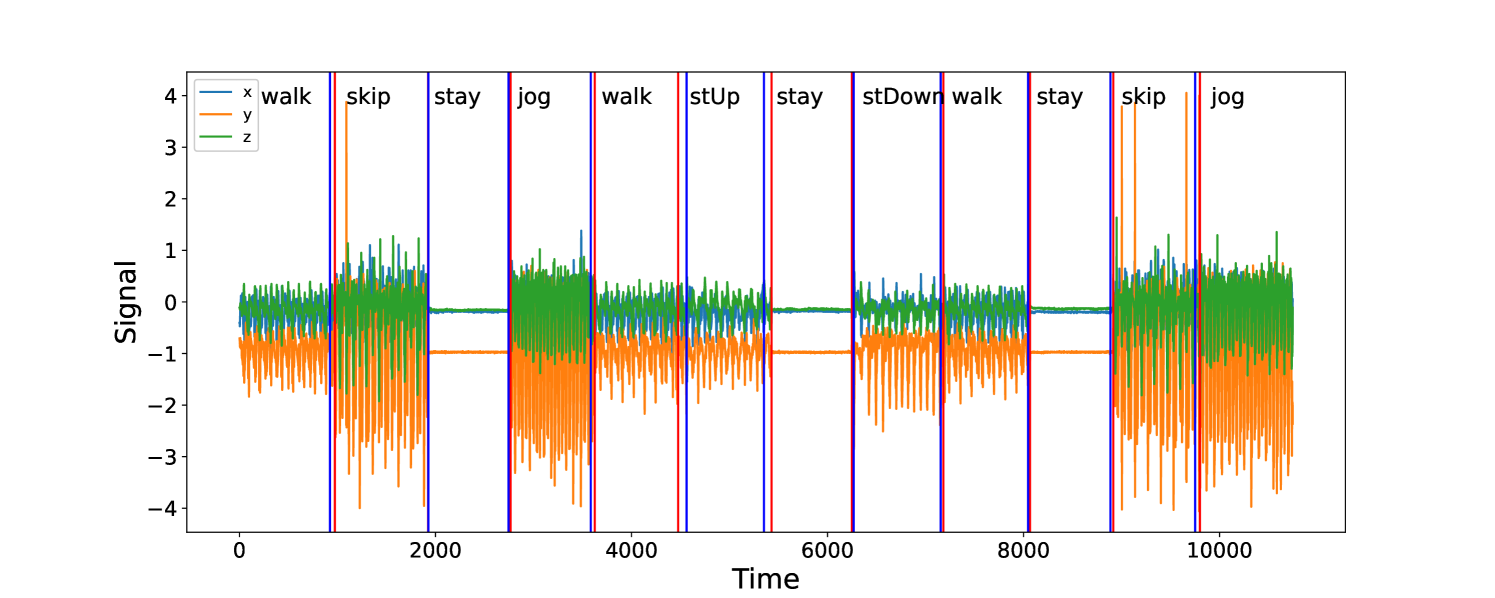
The image is a **line graph** depicting three time-series signals (x, y, z) plotted against a temporal axis. The graph includes labeled vertical markers indicating discrete actions ("walk," "skip," "stay," etc.) at specific time intervals. The signals oscillate around a baseline of 0, with amplitudes ranging from -4 to +4.
---
### **Axis Labels and Markers**
- **X-Axis (Time):**
- Label: "Time"
- Range: 0 to 10,000 (in increments of 2,000)
- Key Markers:
- Vertical lines with labels at:
- 0: `walk`
- 1,500: `skip`
- 3,000: `stay`
- 4,500: `jog`
- 6,000: `walk`
- 7,500: `stUp`
- 9,000: `stay`
- 10,500: `stDown`
- 12,000: `walk`
- 13,500: `stay`
- 15,000: `skip`
- 16,500: `jog`
- **Y-Axis (Signal):**
- Label: "Signal"
- Range: -4 to +4 (in increments of 1)
---
### **Legend**
- **Location:** Top-left corner
- **Labels and Colors:**
- `x` (blue line)
- `y` (orange line)
- `z` (green line)
---
### **Data Series Analysis**
#### 1. **Blue Line (x-Signal)**
- **Trend:**
- Oscillates symmetrically around 0.
- Peaks at ±2 during "walk" and "jog" actions.
- Minimal deviation during "stay" and "stUp/stDown."
- **Key Points:**
- At `t=0` (walk): Peaks at +2.
- At `t=6,000` (walk): Peaks at +2.
- At `t=12,000` (walk): Peaks at +2.
#### 2. **Orange Line (y-Signal)**
- **Trend:**
- Sharp vertical spikes during "skip" actions.
- Flatline at 0 during "stay" and "stUp/stDown."
- Moderate oscillations during "walk" and "jog."
- **Key Points:**
- At `t=1,500` (skip): Spikes to +4.
- At `t=15,000` (skip): Spikes to +4.
#### 3. **Green Line (z-Signal)**
- **Trend:**
- Peaks at ±2 during "jog" actions.
- Flatline at 0 during "stay" and "stUp/stDown."
- Moderate oscillations during "walk" and "skip."
- **Key Points:**
- At `t=4,500` (jog): Peaks at +2.
- At `t=16,500` (jog): Peaks at +2.
---
### **Action-Signal Correlation**
| Action | Time (t) | Signal Behavior |
|--------------|----------|---------------------------------------------------------------------------------|
| `walk` | 0, 6,000, 12,000 | x peaks at +2; y and z oscillate moderately. |
| `skip` | 1,500, 15,000 | y spikes to +4; x and z oscillate. |
| `stay` | 3,000, 9,000, 13,500 | All signals flatline at 0. |
| `jog` | 4,500, 16,500 | z peaks at +2; x and y oscillate. |
| `stUp` | 7,500 | All signals flatline at 0. |
| `stDown` | 10,500 | All signals flatline at 0. |
---
### **Critical Observations**
1. **Signal Amplitude:**
- `x` and `z` signals exhibit bounded oscillations (±2).
- `y` signal exhibits unbounded spikes (±4) during "skip" actions.
2. **Temporal Patterns:**
- "Walk" and "jog" actions correlate with sustained oscillations in `x` and `z`, respectively.
- "Skip" actions are characterized by abrupt, high-amplitude spikes in `y`.
- "Stay" and transitional actions ("stUp," "stDown") result in signal suppression.
3. **Legend Consistency:**
- All line colors (blue, orange, green) match the legend labels (`x`, `y`, `z`) without discrepancies.
---
### **Conclusion**
The graph illustrates distinct signal patterns tied to specific actions. The `y`-signal (orange) is uniquely sensitive to "skip" actions, while `x` and `z` signals correlate with "walk" and "jog," respectively. No textual data tables or non-English content are present.