## Line Chart: Greedy Accuracy vs. Training Epoch
### Overview
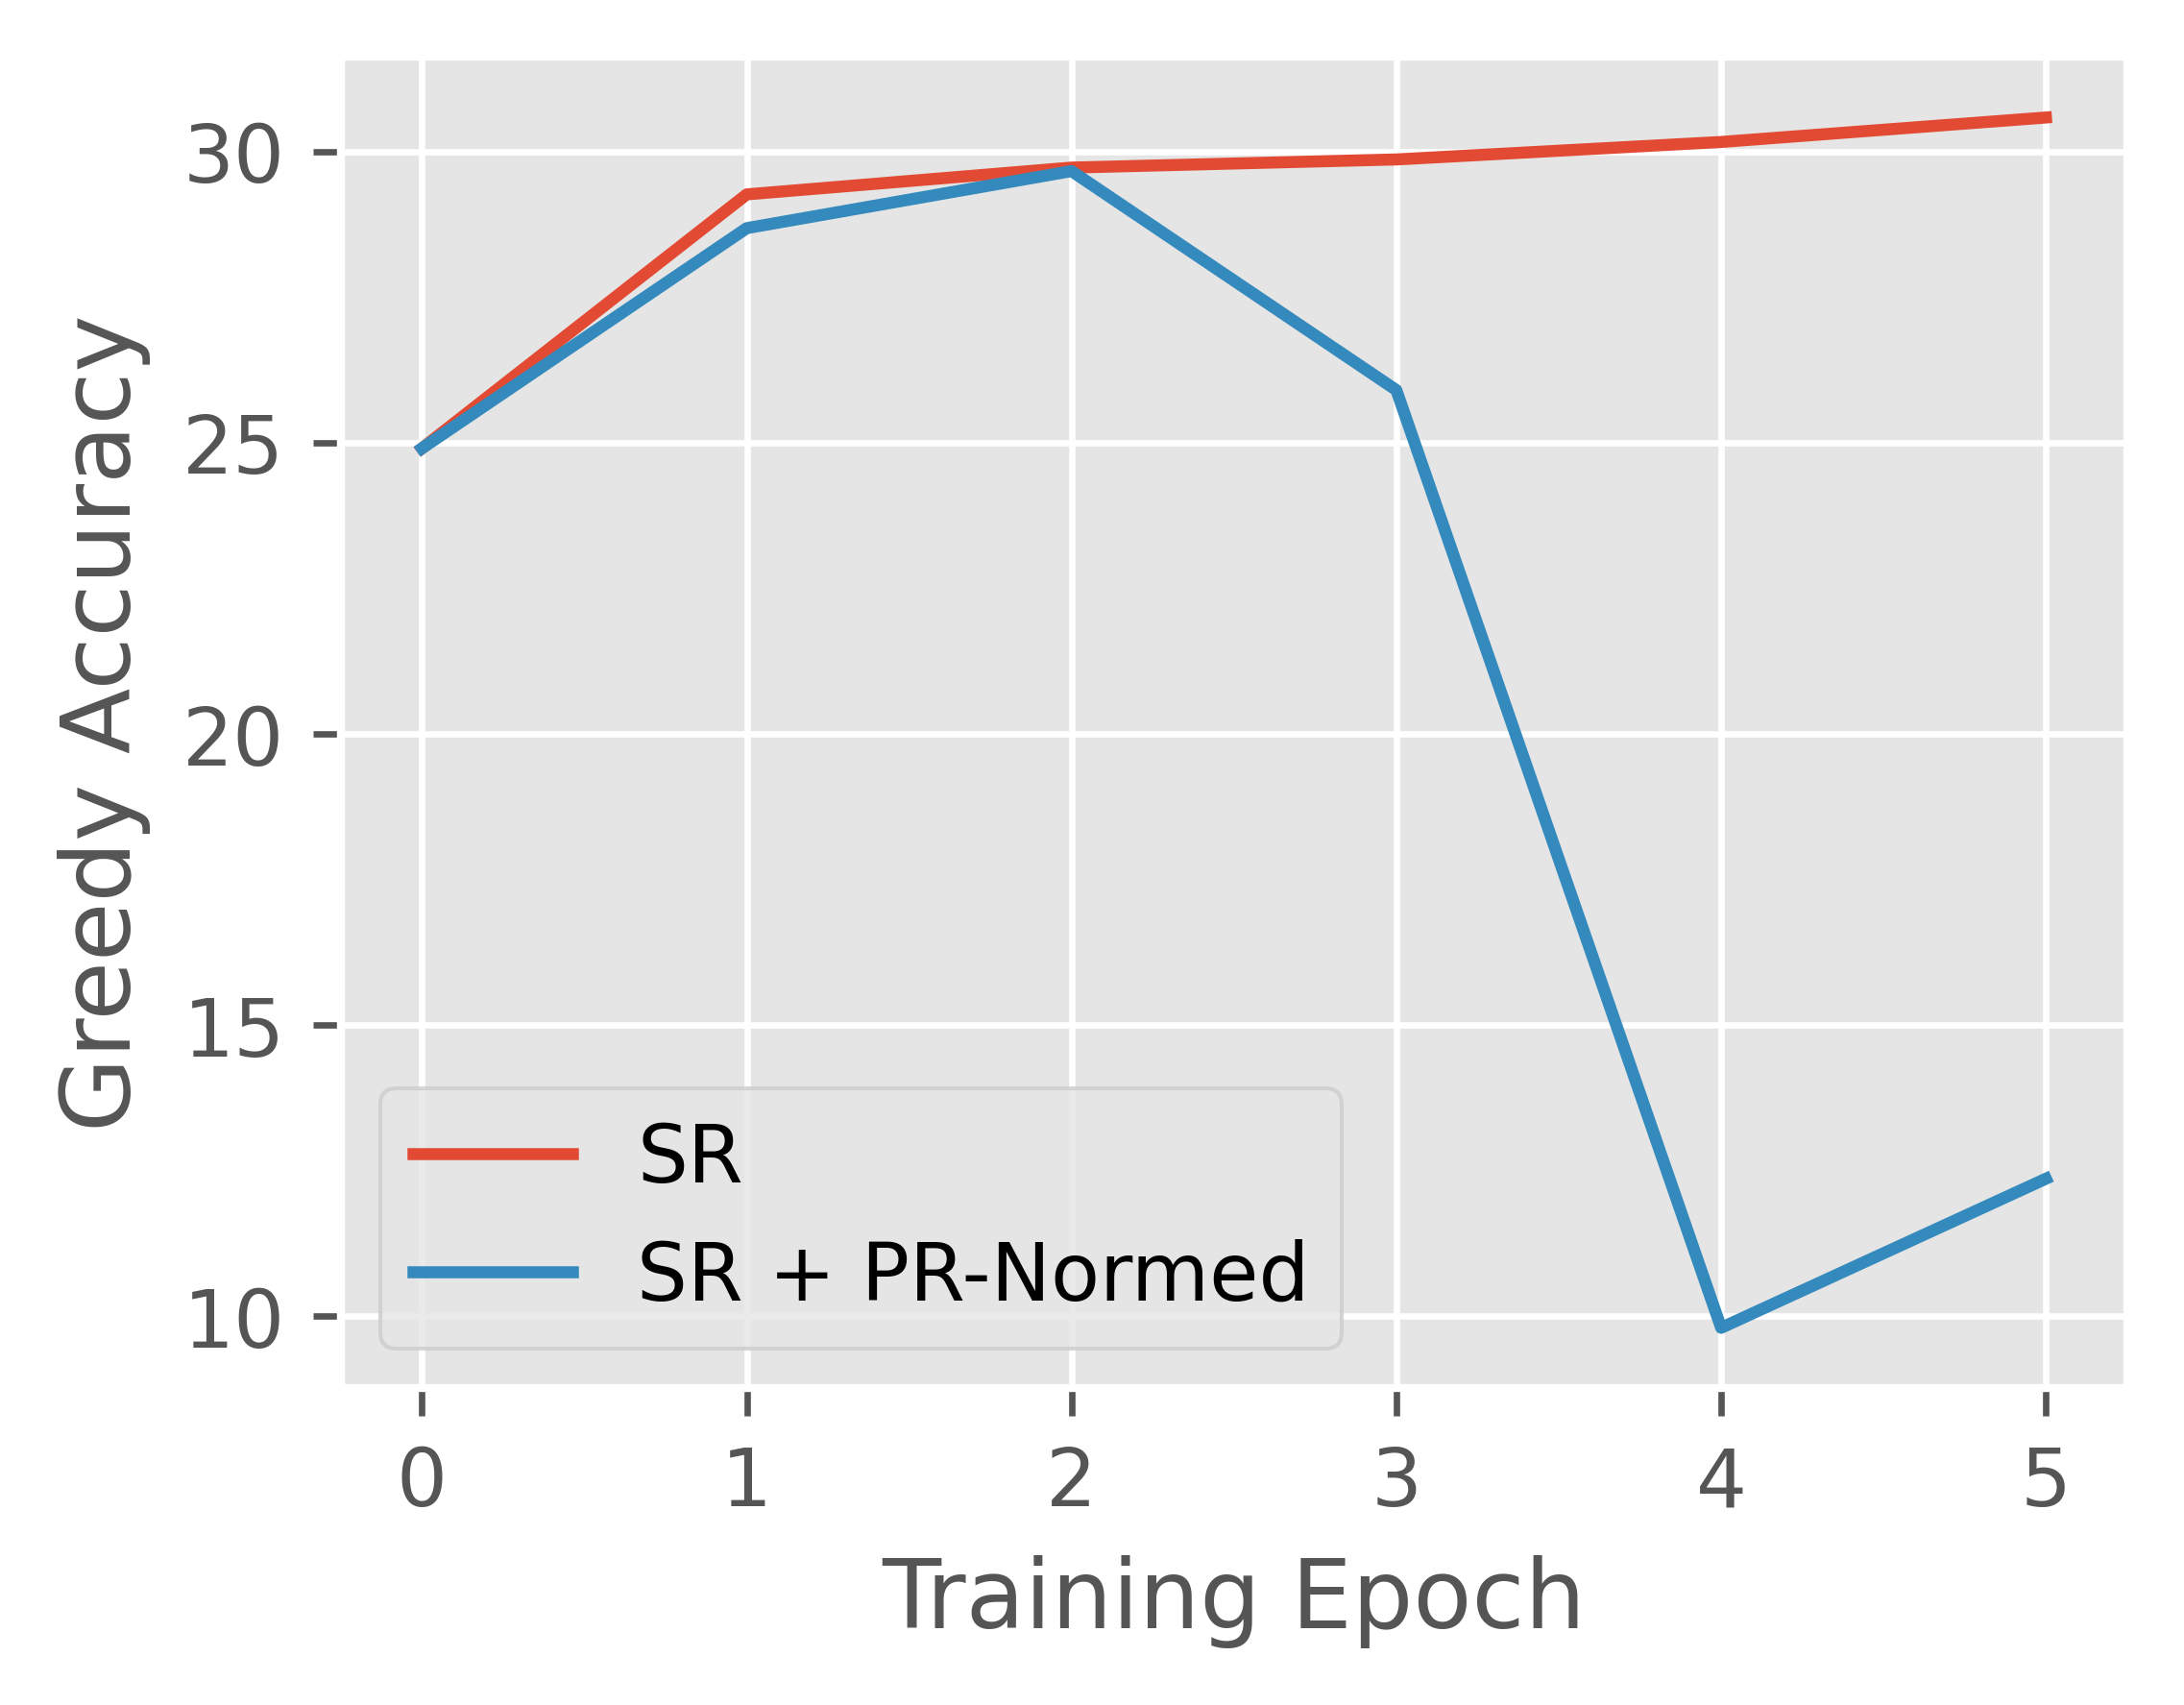
The image is a line chart comparing the "Greedy Accuracy" of two models, "SR" and "SR + PR-Normed", over 6 training epochs (0 to 5). The chart shows how the accuracy changes during training.
### Components/Axes
* **X-axis (Horizontal):** "Training Epoch" with ticks at 0, 1, 2, 3, 4, and 5.
* **Y-axis (Vertical):** "Greedy Accuracy" ranging from approximately 10 to 30, with ticks at 10, 15, 20, 25, and 30.
* **Legend (Bottom-Left):**
* Red line: "SR"
* Blue line: "SR + PR-Normed"
### Detailed Analysis
* **SR (Red Line):**
* Trend: Initially increases, then plateaus, and slightly increases again.
* Epoch 0: ~25
* Epoch 1: ~29
* Epoch 2: ~29.5
* Epoch 3: ~29.7
* Epoch 4: ~30.2
* Epoch 5: ~30.6
* **SR + PR-Normed (Blue Line):**
* Trend: Initially increases, plateaus, then decreases sharply, and finally increases slightly.
* Epoch 0: ~25
* Epoch 1: ~28.5
* Epoch 2: ~29.5
* Epoch 3: ~26
* Epoch 4: ~9.8
* Epoch 5: ~12.5
### Key Observations
* Both models start with the same accuracy at epoch 0.
* The "SR" model consistently improves or plateaus in accuracy throughout the training.
* The "SR + PR-Normed" model experiences a significant drop in accuracy between epochs 3 and 4, before recovering slightly by epoch 5.
* The "SR" model outperforms "SR + PR-Normed" after epoch 3.
### Interpretation
The chart suggests that while "SR + PR-Normed" initially performs comparably to "SR", it suffers a performance degradation during later training epochs. The "SR" model demonstrates more stable and consistent improvement in "Greedy Accuracy" over the training period. The PR-Normed model may require further tuning or a different training regime to prevent the observed accuracy drop.