\n
## Line Chart: Greedy Accuracy vs. Training Epoch
### Overview
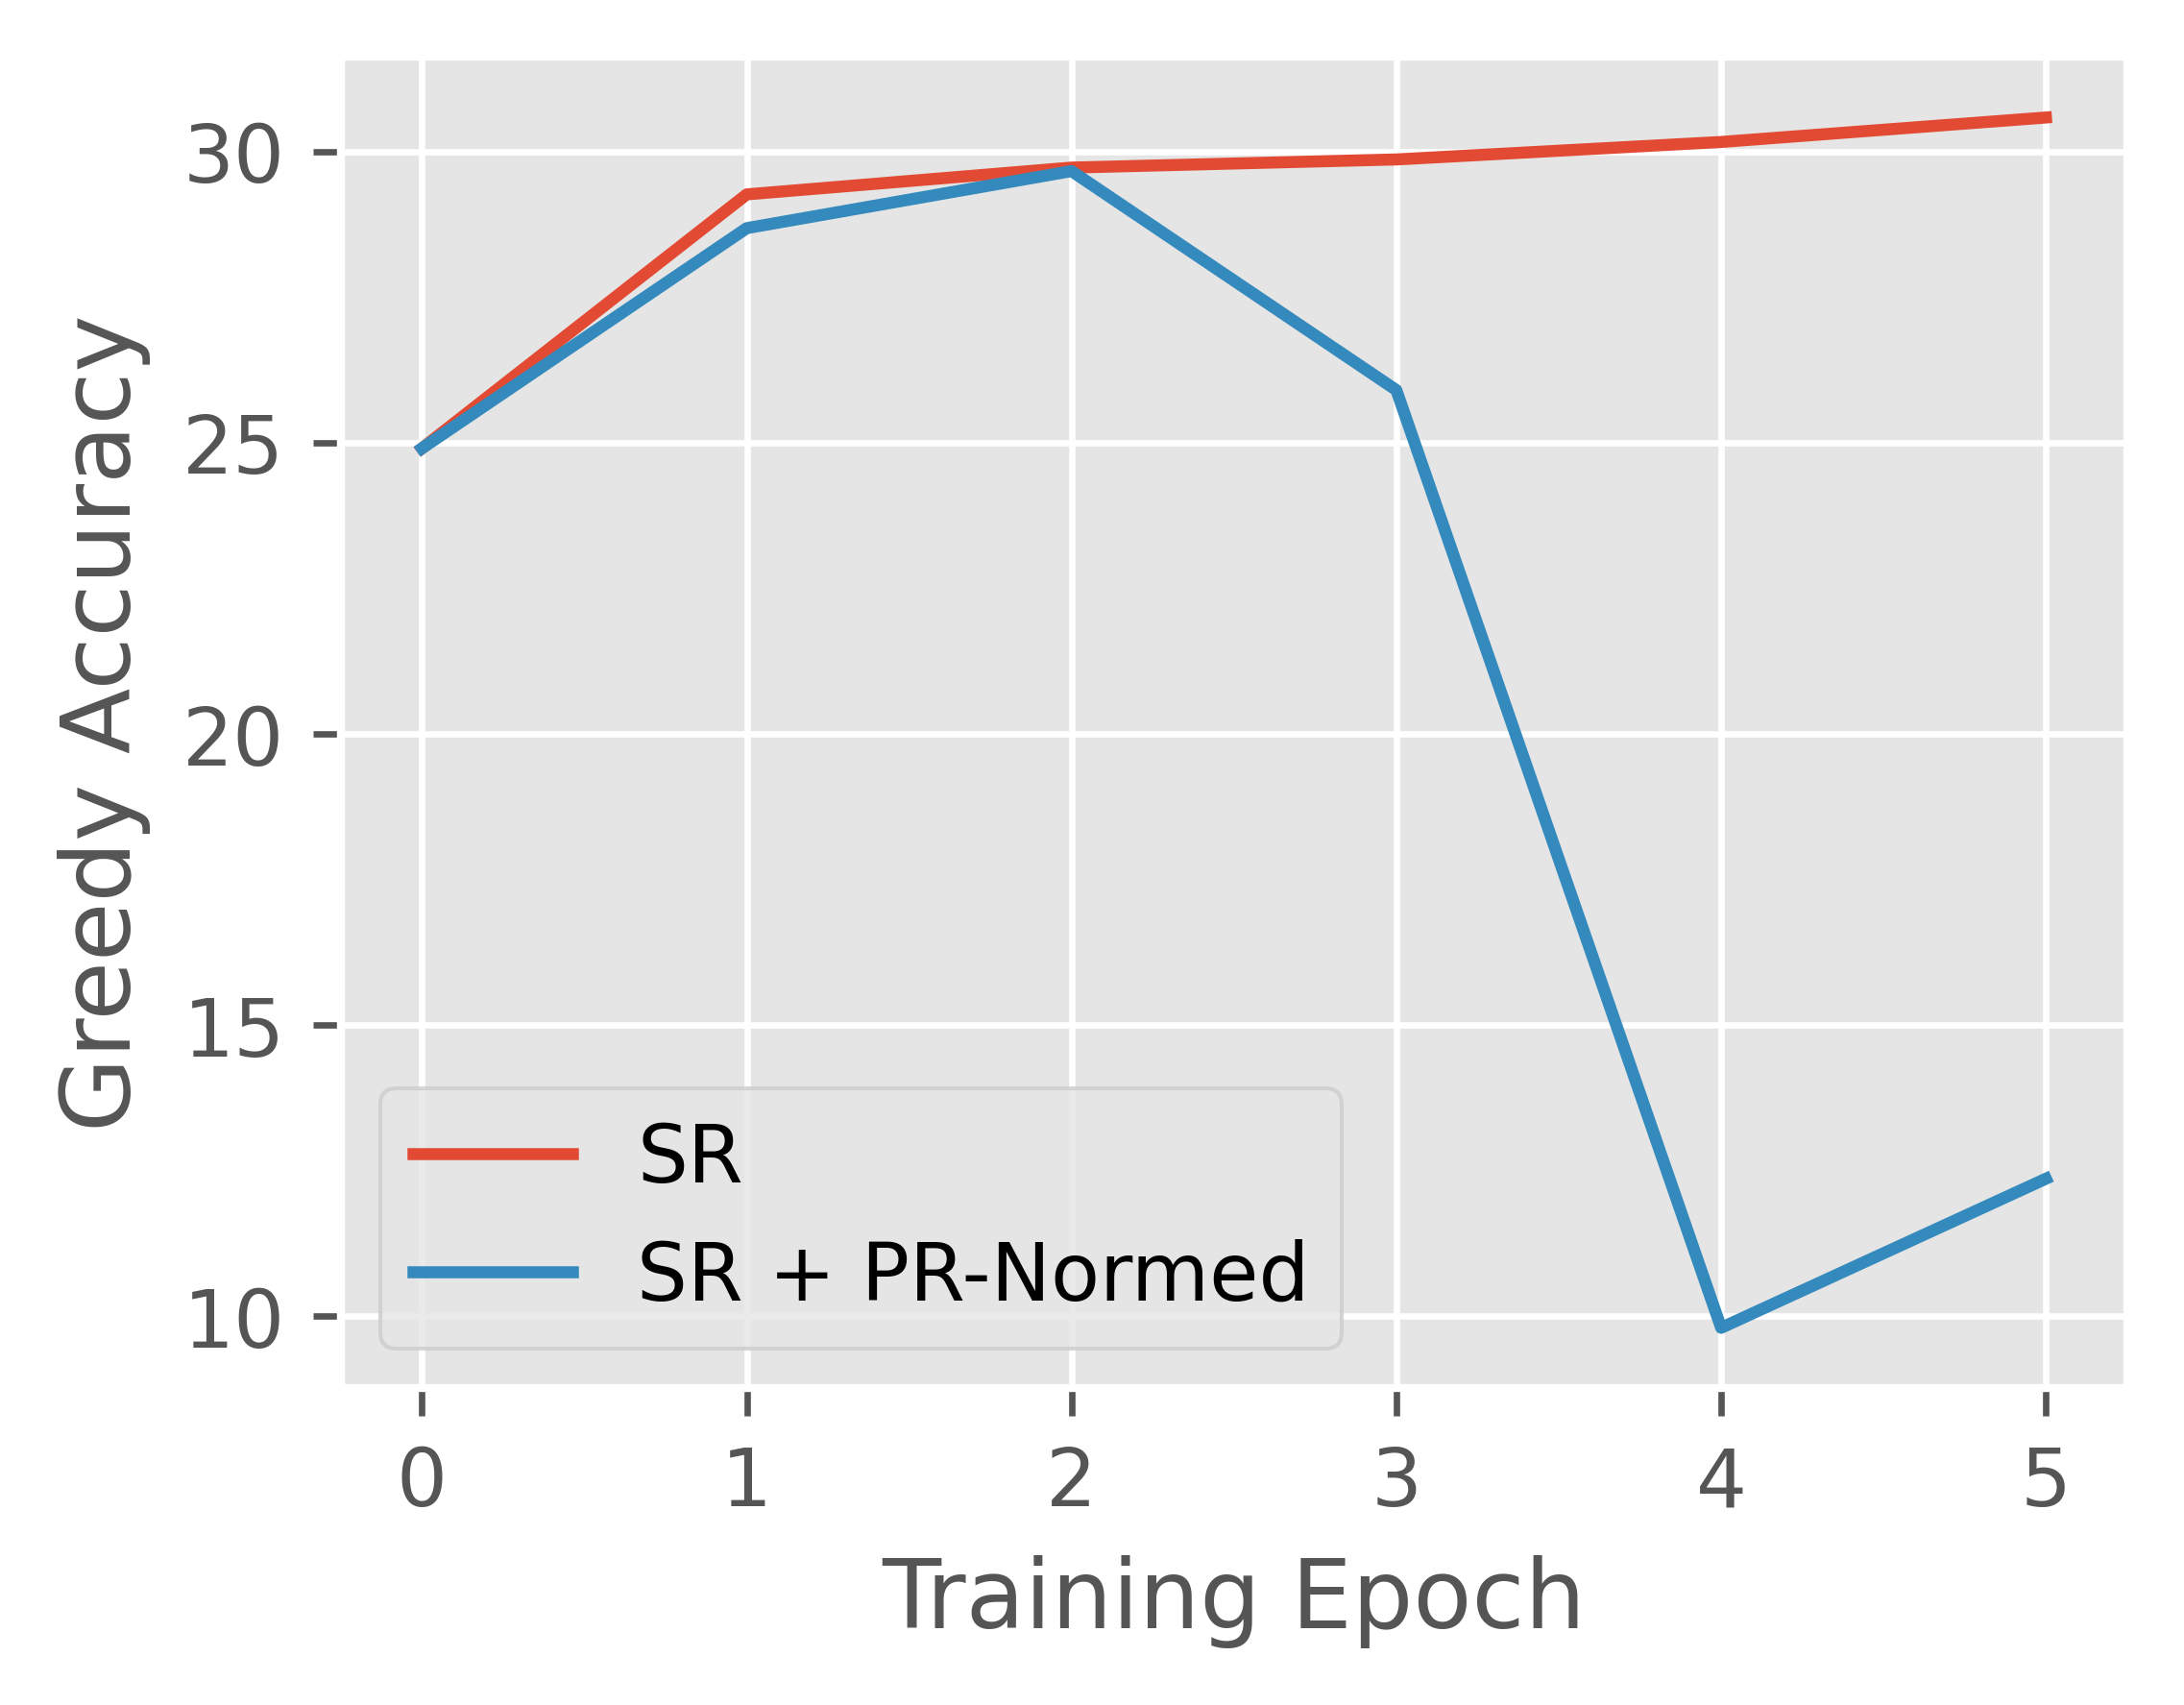
The image displays a line chart comparing the performance of two methods, "SR" and "SR + PR-Normed," over the course of six training epochs (0 through 5). The chart plots "Greedy Accuracy" on the vertical axis against "Training Epoch" on the horizontal axis. The primary visual story is the stark divergence in performance trends between the two methods after the second epoch.
### Components/Axes
* **Chart Type:** Line chart with two data series.
* **X-Axis (Horizontal):**
* **Label:** "Training Epoch"
* **Scale:** Linear, with integer markers from 0 to 5.
* **Y-Axis (Vertical):**
* **Label:** "Greedy Accuracy"
* **Scale:** Linear, with major gridlines and labels at intervals of 5, from 10 to 30.
* **Legend:**
* **Position:** Bottom-left corner of the plot area.
* **Series 1:** "SR" - Represented by a solid red line.
* **Series 2:** "SR + PR-Normed" - Represented by a solid blue line.
* **Background:** Light gray grid with white gridlines.
### Detailed Analysis
**Data Series: SR (Red Line)**
* **Trend:** Shows a steady, monotonic increase that plateaus.
* **Data Points (Approximate):**
* Epoch 0: 25
* Epoch 1: ~29
* Epoch 2: 30
* Epoch 3: ~30
* Epoch 4: ~30.2
* Epoch 5: ~30.5
* **Visual Path:** The line slopes upward sharply from epoch 0 to 1, continues a gentler rise to epoch 2, and then remains nearly flat with a very slight positive slope through epoch 5.
**Data Series: SR + PR-Normed (Blue Line)**
* **Trend:** Shows initial improvement followed by a dramatic collapse and partial recovery.
* **Data Points (Approximate):**
* Epoch 0: 25 (identical starting point to SR)
* Epoch 1: ~28.5
* Epoch 2: 30 (peaks, matching the SR line)
* Epoch 3: ~26
* Epoch 4: 10 (lowest point)
* Epoch 5: ~12
* **Visual Path:** The line follows a similar upward trajectory to the SR line from epoch 0 to 2. After epoch 2, it slopes downward to epoch 3, then plummets steeply to a minimum at epoch 4, before showing a modest upward slope to epoch 5.
### Key Observations
1. **Identical Start:** Both methods begin at the same accuracy (~25) at epoch 0.
2. **Convergence then Divergence:** The two lines track closely until epoch 2, where they both reach an accuracy of approximately 30. After this point, their paths diverge radically.
3. **Catastrophic Drop:** The "SR + PR-Normed" method experiences a severe performance degradation between epochs 2 and 4, losing roughly 20 points of accuracy.
4. **Stability vs. Instability:** The "SR" method demonstrates stable, improving performance throughout training. The "SR + PR-Normed" method exhibits significant instability after an initial period of effective learning.
5. **Partial Recovery:** The blue line shows a slight upward trend from epoch 4 to 5, suggesting a minor recovery from its lowest point, but it remains far below its peak and the performance of the SR method.
### Interpretation
This chart likely illustrates the outcome of an experiment in machine learning or optimization, comparing a baseline method ("SR") with a variant that incorporates an additional technique ("PR-Normed").
* **What the data suggests:** The "PR-Normed" addition appears beneficial or neutral in the very early stages of training (epochs 0-2), matching the baseline's performance. However, it introduces a critical instability that manifests after epoch 2, leading to a collapse in greedy accuracy. This could indicate issues like overfitting, gradient instability, or a harmful interaction between the PR-Normed technique and the training dynamics as the model converges.
* **How elements relate:** The x-axis (Training Epoch) is the independent variable, showing the progression of the training process. The y-axis (Greedy Accuracy) is the dependent performance metric. The legend defines the experimental conditions. The direct comparison of the two lines on the same axes allows for a clear, controlled assessment of the "PR-Normed" technique's impact.
* **Notable anomalies:** The most striking anomaly is the precipitous drop in the blue line after epoch 2. This is not a gradual decline but a sharp failure, which is a significant red flag for the reliability of the "SR + PR-Normed" method. The fact that both methods peak at the same point (epoch 2) before diverging suggests that the instability is triggered by a specific phase or state in the training process.