## Bar Chart: R1-Qwen | AMC23
### Overview
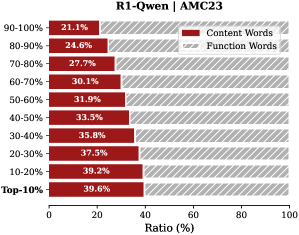
The chart compares the distribution of **Content Words** (red) and **Function Words** (gray with diagonal stripes) across performance-based percentage ranges (90-100% to Top-10%). Each bar represents the ratio (%) of these word types within specific performance tiers.
### Components/Axes
- **Title**: "R1-Qwen | AMC23" (top-center).
- **Legend**:
- Red: Content Words.
- Gray (diagonal stripes): Function Words.
- **Y-Axis**: Performance tiers labeled as percentage ranges (90-100%, 80-90%, ..., Top-10%), ordered from highest to lowest.
- **X-Axis**: "Ratio (%)" with a scale from 0 to 100.
- **Bars**: Horizontal bars for each category, positioned side-by-side under their respective performance tier.
### Detailed Analysis
- **Content Words (Red)**:
- 90-100%: 21.1%
- 80-90%: 24.6%
- 70-80%: 27.7%
- 60-70%: 30.1%
- 50-60%: 31.9%
- 40-50%: 33.5%
- 30-40%: 35.8%
- 20-30%: 37.5%
- 10-20%: 39.2%
- Top-10%: 39.6%
- **Function Words (Gray)**:
- 90-100%: 78.9% (100% - 21.1%)
- 80-90%: 75.4% (100% - 24.6%)
- 70-80%: 72.3% (100% - 27.7%)
- 60-70%: 69.9% (100% - 30.1%)
- 50-60%: 68.1% (100% - 31.9%)
- 40-50%: 66.5% (100% - 33.5%)
- 30-40%: 64.2% (100% - 35.8%)
- 20-30%: 62.5% (100% - 37.5%)
- 10-20%: 60.8% (100% - 39.2%)
- Top-10%: 60.4% (100% - 39.6%)
### Key Observations
1. **Inverse Relationship**: As performance tiers decrease (moving down the y-axis), the ratio of **Content Words** increases, while **Function Words** decrease.
2. **Dominance of Function Words**: Function Words consistently occupy the majority (>60%) in all tiers, with the highest proportion in the 90-100% tier (78.9%).
3. **Content Words Growth**: Content Words show a steady increase from 21.1% (90-100%) to 39.6% (Top-10%), suggesting a shift toward content-focused language in lower-performing tiers.
### Interpretation
The data implies that higher-performing tiers (e.g., 90-100%) rely more heavily on **Function Words** (e.g., prepositions, conjunctions), which may indicate structural or grammatical complexity. In contrast, lower-performing tiers (e.g., Top-10%) exhibit a greater proportion of **Content Words** (e.g., nouns, verbs), potentially reflecting a focus on substantive content over linguistic structure. This trend could highlight a trade-off between grammatical precision and content richness in performance metrics. The consistent dominance of Function Words across all tiers suggests their foundational role in language processing, even as Content Words gain prominence in less optimal performance ranges.