## Bar Chart: Word Ratio Distribution
### Overview
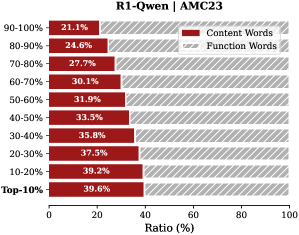
This is a horizontal bar chart displaying the ratio of content words to function words across different percentage ranges. The chart is titled "R1-Qwen | AMC23" at the top-center. The x-axis represents the ratio in percentage, and the y-axis represents the percentage ranges of word occurrences.
### Components/Axes
* **Title:** R1-Qwen | AMC23 (Top-center)
* **X-axis Label:** Ratio (%) (Bottom-center)
* **Y-axis Labels:**
* Top 10%
* 10-20%
* 20-30%
* 30-40%
* 40-50%
* 50-60%
* 60-70%
* 70-80%
* 80-90%
* 90-100%
* **Legend:** (Top-right)
* Content Words (Dark Red)
* Function Words (Light Gray)
### Detailed Analysis
The chart consists of horizontal bars, each representing a percentage range. Each bar is divided into two sections: a dark red section representing "Content Words" and a light gray section representing "Function Words". The length of each section corresponds to the ratio of that word type within the given percentage range.
Here's a breakdown of the data points, reading from top to bottom:
* **90-100%:** Content Words: 21.1%, Function Words: Approximately 78.9% (calculated as 100% - 21.1%)
* **80-90%:** Content Words: 24.6%, Function Words: Approximately 75.4%
* **70-80%:** Content Words: 27.7%, Function Words: Approximately 72.3%
* **60-70%:** Content Words: 30.1%, Function Words: Approximately 69.9%
* **50-60%:** Content Words: 31.9%, Function Words: Approximately 68.1%
* **40-50%:** Content Words: 33.5%, Function Words: Approximately 66.5%
* **30-40%:** Content Words: 35.8%, Function Words: Approximately 64.2%
* **20-30%:** Content Words: 37.5%, Function Words: Approximately 62.5%
* **10-20%:** Content Words: 39.2%, Function Words: Approximately 60.8%
* **Top 10%:** Content Words: 39.6%, Function Words: Approximately 60.4%
**Trend Verification:** The dark red "Content Words" bars consistently increase in length as we move down the chart (from 90-100% to Top 10%), indicating a higher ratio of content words in the lower percentage ranges. Conversely, the light gray "Function Words" bars decrease in length, showing a lower ratio of function words in those ranges.
### Key Observations
* The ratio of content words is significantly lower in the higher percentage ranges (90-100%) compared to the lower percentage ranges (Top 10%).
* The increase in content word ratio is relatively consistent across the percentage ranges, suggesting a gradual shift in word type distribution.
* The difference between the highest and lowest content word ratios is approximately 18.5% (39.6% - 21.1%).
### Interpretation
The chart demonstrates the distribution of content and function words within a text corpus (likely related to the "R1-Qwen" model and "AMC23" dataset). The increasing ratio of content words as we move down the percentage ranges suggests that the most frequent words in the text are predominantly content words. This could indicate that the text is information-rich and focuses on conveying specific meaning rather than grammatical structure. The decreasing ratio of function words implies that the text relies less on articles, prepositions, and other grammatical elements.
The chart provides insights into the linguistic characteristics of the text, which could be valuable for natural language processing tasks such as text summarization, keyword extraction, and sentiment analysis. The data suggests that the text is likely to be more focused on semantic content than on grammatical relationships. The consistent trend suggests a systematic pattern in the word distribution, rather than random fluctuations.