## Chart: Predicted vs. Measured Performance
### Overview
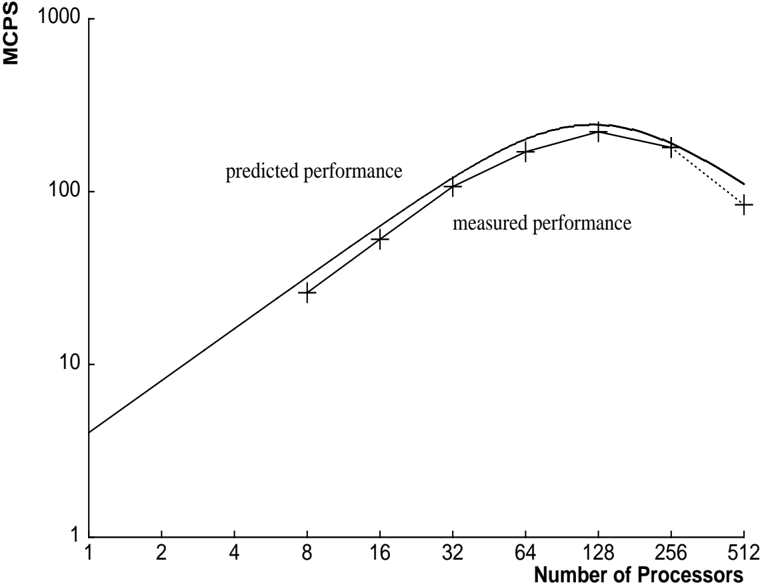
The image is a line chart comparing predicted and measured performance (in MCPS) against the number of processors. Both axes use a logarithmic scale. The chart shows how performance scales with an increasing number of processors, highlighting the difference between predicted and actual performance.
### Components/Axes
* **Y-axis:** MCPS (Millions of Connections Per Second). Logarithmic scale with markers at 1, 10, 100, and 1000.
* **X-axis:** Number of Processors. Logarithmic scale with markers at 1, 2, 4, 8, 16, 32, 64, 128, 256, and 512.
* **Legend:**
* "predicted performance": Represented by a solid black line.
* "measured performance": Represented by '+' markers connected by a dotted black line after the 128 processor mark.
### Detailed Analysis
* **Predicted Performance (Solid Black Line):**
* Trend: Initially increases sharply, then plateaus and decreases slightly.
* Data Points:
* 1 processor: ~2 MCPS
* 8 processors: ~25 MCPS
* 32 processors: ~100 MCPS
* 64 processors: ~150 MCPS
* 128 processors: ~200 MCPS
* 256 processors: ~180 MCPS
* 512 processors: ~100 MCPS
* **Measured Performance (+ Markers):**
* Trend: Increases sharply, plateaus, and then decreases.
* Data Points:
* 8 processors: ~20 MCPS
* 16 processors: ~40 MCPS
* 32 processors: ~70 MCPS
* 64 processors: ~120 MCPS
* 128 processors: ~180 MCPS
* 256 processors: ~160 MCPS
* 512 processors: ~80 MCPS
### Key Observations
* The predicted performance consistently overestimates the measured performance.
* Both predicted and measured performance peak around 128 processors.
* The measured performance starts to decline more sharply than predicted performance after 128 processors.
### Interpretation
The chart illustrates the diminishing returns of adding more processors to a system. While the predicted performance suggests a continued increase (albeit at a slower rate) up to a certain point, the measured performance shows a clear peak and subsequent decline. This indicates that factors such as communication overhead or resource contention become significant bottlenecks as the number of processors increases. The divergence between predicted and measured performance highlights the importance of empirical testing and validation in system design. The logarithmic scales emphasize the exponential nature of the initial performance gains and the subsequent limitations.