## Line Chart: Predicted vs. Measured Performance vs. Number of Processors
### Overview
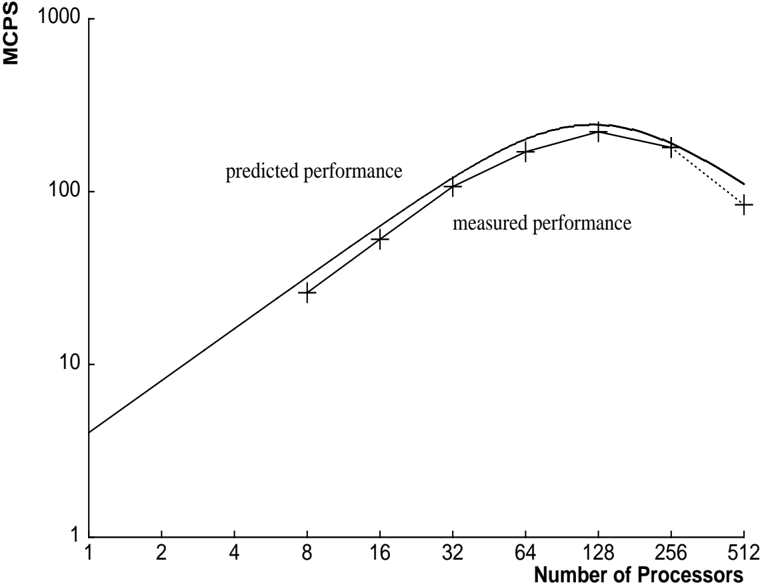
The image depicts a logarithmic-scale line chart comparing **predicted performance** (solid line) and **measured performance** (dotted line) across a range of processor counts (1 to 512). The y-axis represents **MCPS** (Millions of Calculations Per Second), while the x-axis represents the **Number of Processors**. Data points are marked with "+" symbols along both lines.
---
### Components/Axes
- **X-Axis (Horizontal)**:
- Label: "Number of Processors"
- Scale: Logarithmic (1, 2, 4, 8, 16, 32, 64, 128, 256, 512)
- Position: Bottom of the chart
- **Y-Axis (Vertical)**:
- Label: "MCPS" (Millions of Calculations Per Second)
- Scale: Linear (1, 10, 100, 1000)
- Position: Left side of the chart
- **Legend**:
- Position: Center of the chart
- Labels:
- Solid line: "predicted performance"
- Dotted line: "measured performance"
- **Data Points**:
- "+" symbols placed along both lines at specific processor counts (e.g., 8, 16, 32, 64, 128, 256).
---
### Detailed Analysis
1. **Predicted Performance (Solid Line)**:
- Starts at ~5 MCPS for 1 processor.
- Increases steadily, reaching ~500 MCPS at 256 processors.
- Peaks at ~600 MCPS at 128 processors before declining slightly.
2. **Measured Performance (Dotted Line)**:
- Starts at ~3 MCPS for 1 processor.
- Follows a similar upward trend but lags behind predictions.
- At 64 processors: ~200 MCPS (vs. predicted 300 MCPS).
- At 128 processors: ~350 MCPS (vs. predicted 600 MCPS).
- At 256 processors: ~250 MCPS (vs. predicted 500 MCPS).
3. **Data Point Placement**:
- Points are evenly spaced along the x-axis (e.g., 8, 16, 32, 64, 128, 256).
- Measured performance deviates most significantly at higher processor counts (e.g., 128–256).
---
### Key Observations
- **Divergence at Scale**: Measured performance diverges sharply from predictions at 128+ processors, suggesting inefficiencies or bottlenecks in scaling.
- **Peak at 128 Processors**: Both lines peak at 128 processors, but measured performance drops afterward, while predicted performance remains stable.
- **Logarithmic X-Axis**: The exponential growth in processor counts (1→512) emphasizes scalability challenges.
---
### Interpretation
- **Model Limitations**: The predicted performance assumes ideal scaling, but measured results reveal diminishing returns at higher processor counts, likely due to hardware constraints (e.g., memory bandwidth, communication overhead).
- **Optimistic Predictions**: The model overestimates performance gains beyond 64 processors, highlighting the need for revised scalability assumptions.
- **Practical Implications**: Systems designed for >128 processors may require architectural optimizations to align measured performance with predictions.
---
*Note: All values are approximate, with uncertainty due to the logarithmic scale and visual estimation of data points.*