## Bar Chart: Number of Papers per Year from 1684 to 2023
### Overview
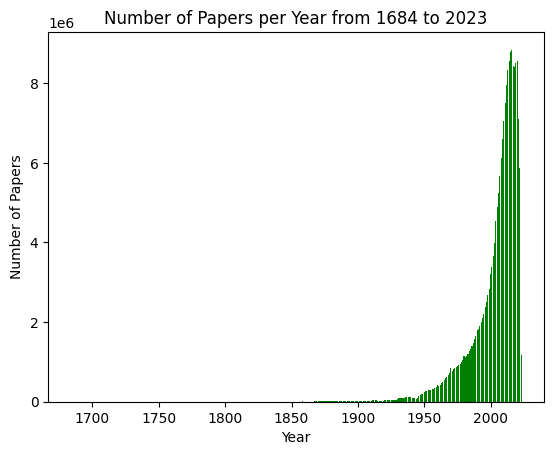
The image is a bar chart showing the number of papers published per year from 1684 to 2023. The x-axis represents the year, and the y-axis represents the number of papers. The number of papers published remains relatively low until around 1950, after which it increases exponentially, peaking around 2023.
### Components/Axes
* **Title:** Number of Papers per Year from 1684 to 2023
* **X-axis:**
* Label: Year
* Scale: 1700, 1750, 1800, 1850, 1900, 1950, 2000
* **Y-axis:**
* Label: Number of Papers
* Scale: 0, 2e6, 4e6, 6e6, 8e6 (where e6 means times 10 to the power of 6, or millions)
* **Data:** The data is represented by green bars.
### Detailed Analysis
* **Trend:** The number of papers published remains relatively low until around 1950. After 1950, the number of papers increases exponentially.
* **Specific Values:**
* From 1684 to 1900, the number of papers published is close to zero.
* Around 1950, the number of papers starts to increase.
* Around 2000, the number of papers increases dramatically.
* Around 2023, the number of papers peaks at approximately 8.8e6 (8,800,000).
### Key Observations
* The number of papers published has increased dramatically in recent years.
* The increase in the number of papers published is exponential.
* The peak in the number of papers published occurs around 2023.
### Interpretation
The chart illustrates the exponential growth in the number of published papers, particularly in the latter half of the 20th century and the early 21st century. This growth could be attributed to various factors, including increased research funding, technological advancements in publishing, and a growing global population of researchers. The relatively low number of publications before 1950 suggests a slower pace of research and dissemination of knowledge in earlier periods. The steep increase after 1950 indicates a significant acceleration in scientific output.