## Bar Chart: Number of Papers per Year from 1684 to 2023
### Overview
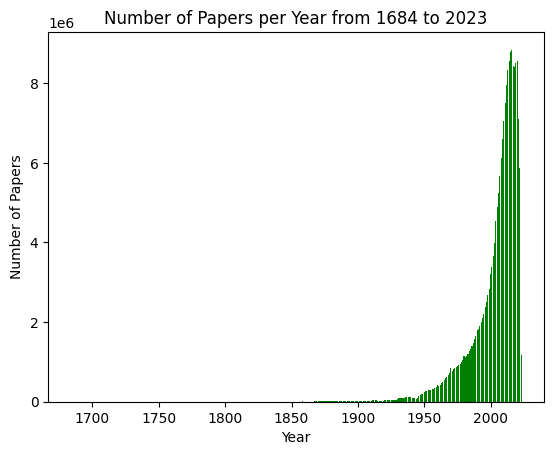
This image is a bar chart illustrating the annual volume of academic or scientific papers published over a period spanning from 1684 to 2023. The chart displays a clear, exponential growth trend, characterized by a long period of negligible output followed by a massive surge in publication volume starting in the mid-20th century.
### Components/Axes
* **Title:** "Number of Papers per Year from 1684 to 2023" (Centered at the top).
* **X-Axis:** Labeled "Year". The axis spans from approximately 1684 to 2023. Major tick marks are provided at 50-year intervals: 1700, 1750, 1800, 1850, 1900, 1950, and 2000.
* **Y-Axis:** Labeled "Number of Papers". The scale is in scientific notation, indicated by "1e6" at the top left, meaning the values on the axis (0, 2, 4, 6, 8) represent millions (0, 2,000,000, 4,000,000, 6,000,000, 8,000,000).
* **Data Series:** Represented by green vertical bars. Each bar corresponds to the number of papers published in a specific year.
### Detailed Analysis
* **Trend Verification:**
* **1684–1900:** The bars are barely visible, indicating that the number of papers published annually was statistically insignificant compared to modern figures (likely near zero on this scale).
* **1900–1950:** A slow, gradual upward slope begins. The bars become visible but remain low relative to the total scale.
* **1950–2022:** A dramatic, exponential upward curve. The height of the bars increases rapidly, accelerating significantly after the year 2000.
* **2023:** A sharp, anomalous drop-off occurs at the final data point.
* **Estimated Data Points:**
* **~1950:** The volume is approximately 0.2 to 0.3 million (200,000–300,000) papers.
* **~1980:** The volume reaches approximately 1 million papers.
* **~2000:** The volume is approximately 2 million papers.
* **~2010:** The volume is approximately 4 to 5 million papers.
* **~2022:** The peak of the chart, reaching approximately 8.5 to 9 million papers.
* **2023:** The final bar drops significantly, likely to under 2 million, indicating incomplete data for the current year.
### Key Observations
* **Exponential Growth:** The chart demonstrates a classic "hockey stick" growth pattern, typical of data representing the expansion of scientific research, digital publishing, and global academic participation.
* **Data Truncation:** The final bar (2023) is significantly lower than the preceding years. This is a critical visual artifact indicating that the data for 2023 is partial (likely the chart was generated before the end of the year).
* **Scale Magnitude:** The jump from near-zero to nearly 9 million papers per year highlights the massive scale of modern knowledge production compared to the pre-industrial and early industrial eras.
### Interpretation
The data suggests a profound transformation in the global research landscape. The transition from a flat line to a near-vertical ascent indicates that the vast majority of human scientific output has been produced in the last 50–70 years.
This trend is likely driven by several factors:
1. **Institutionalization:** The professionalization of science and the increase in the number of universities and research institutions globally.
2. **"Publish or Perish":** The increasing pressure on academics to produce frequent publications for career advancement.
3. **Digitalization:** The shift from print to digital publishing, which lowered the barriers to entry and increased the speed of dissemination.
4. **Global Participation:** The expansion of the scientific community beyond Western nations to include significant contributions from Asia and other developing regions.
The sharp drop at the end of the chart is a cautionary note regarding data interpretation; it serves as a reminder that the most recent data point in a time-series chart often represents an incomplete period rather than a genuine decline in productivity.