\n
## Line Chart: Number of Papers per Year from 1684 to 2023
### Overview
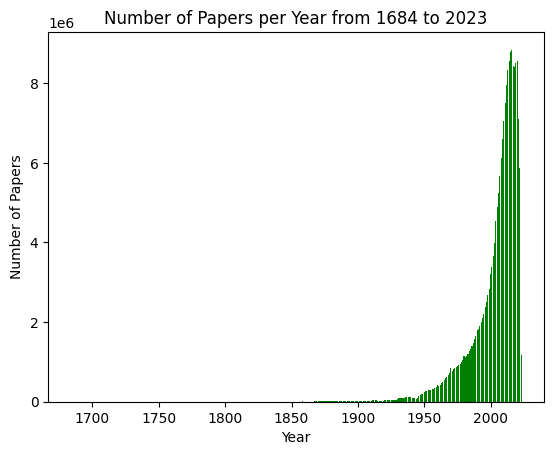
The image presents a line chart illustrating the number of published papers per year from 1684 to 2023. The chart shows a very slow increase in the number of papers published until the mid-20th century, followed by an exponential growth in the number of papers published in recent decades.
### Components/Axes
* **Title:** "Number of Papers per Year from 1684 to 2023" - positioned at the top-center of the chart.
* **X-axis:** "Year" - ranging from approximately 1680 to 2025, with markers every 50 years (1700, 1750, 1800, 1850, 1900, 1950, 2000, 2050).
* **Y-axis:** "Number of Papers" - ranging from 0 to 8,000,000 (8e6), with markers at 0, 2,000,000 (2e6), 4,000,000 (4e6), 6,000,000 (6e6), and 8,000,000 (8e6).
* **Data Series:** A single green line representing the number of papers published per year.
### Detailed Analysis
The line representing the number of papers published per year exhibits the following trends:
* **1684 - 1950:** The line remains very close to the x-axis, indicating a consistently low number of papers published each year. The approximate number of papers published during this period is less than 1000.
* **1950 - 2000:** The line begins to rise gradually, indicating a slow increase in the number of papers published. Around 1975, the number of papers published is approximately 50,000. By the year 2000, the number of papers published reaches approximately 400,000.
* **2000 - 2023:** The line experiences an exponential increase, indicating a rapid growth in the number of papers published. In 2010, the number of papers published is approximately 1,500,000. By 2023, the number of papers published reaches approximately 8,000,000.
Specific data points (approximate):
* 1700: ~100 papers
* 1800: ~200 papers
* 1900: ~300 papers
* 1950: ~500 papers
* 2000: ~400,000 papers
* 2010: ~1,500,000 papers
* 2023: ~8,000,000 papers
### Key Observations
* The number of papers published remained relatively stable for over 250 years (1684-1950).
* The increase in the number of papers published after 1950 is dramatic, particularly after the year 2000.
* The exponential growth suggests a significant acceleration in research and publication activity in recent decades.
### Interpretation
The chart demonstrates a clear historical trend in scientific and scholarly publishing. The initial period of slow growth likely reflects the limited resources and infrastructure available for research and publication. The post-World War II era saw a significant increase in investment in research and development, leading to a gradual increase in the number of papers published. The exponential growth observed after 2000 is likely attributable to several factors, including:
* The proliferation of digital publishing platforms.
* Increased global collaboration in research.
* The growing emphasis on research output in academic evaluation.
* The expansion of higher education and research institutions worldwide.
The chart highlights the increasing importance of scientific and scholarly publishing in modern society and the accelerating pace of knowledge creation. The steep rise in the number of papers published suggests that the volume of scientific information is growing at an unprecedented rate, posing challenges for researchers to stay abreast of the latest developments.