## Bar Chart: Number of Papers per Year from 1684 to 2023
### Overview
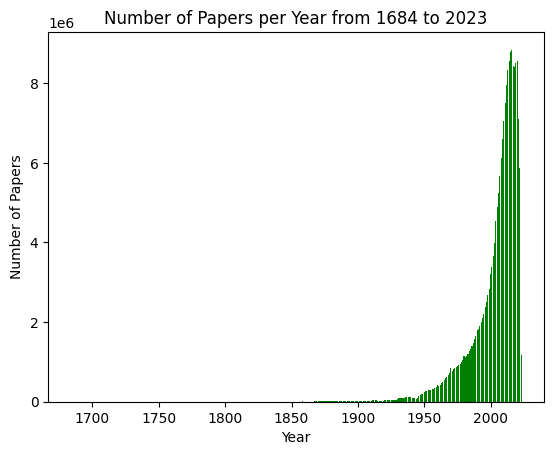
This is a vertical bar chart illustrating the annual volume of published academic or scientific papers over a 339-year period, from 1684 to 2023. The chart demonstrates a dramatic, exponential increase in publication output, particularly in the late 20th and early 21st centuries.
### Components/Axes
* **Chart Title:** "Number of Papers per Year from 1684 to 2023" (centered at the top).
* **X-Axis (Horizontal):**
* **Label:** "Year" (centered below the axis).
* **Scale:** Linear scale from approximately 1684 to 2023.
* **Major Tick Marks:** Labeled at 50-year intervals: 1700, 1750, 1800, 1850, 1900, 1950, 2000.
* **Y-Axis (Vertical):**
* **Label:** "Number of Papers" (centered to the left of the axis).
* **Scale:** Linear scale from 0 to 8,000,000 (8e6).
* **Major Tick Marks:** Labeled at intervals of 2,000,000: 0, 2e6, 4e6, 6e6, 8e6. The axis uses scientific notation (1e6) at the top to indicate the scale multiplier.
* **Data Series:** A single series represented by green vertical bars. Each bar's height corresponds to the number of papers for a specific year. There is no legend, as only one data category is presented.
* **Spatial Layout:** The plot area is framed by the axes. The title is positioned above the plot. The x-axis labels are below the axis line, and the y-axis labels are to the left of the axis line.
### Detailed Analysis
* **Trend Verification:** The data series shows a clear, accelerating upward trend. The line formed by the tops of the bars is nearly flat for the first two centuries, begins a very gradual rise in the late 19th century, and transitions into a steep, exponential climb from the mid-20th century onward.
* **Data Point Extraction (Approximate):**
* **1684 - ~1850:** The number of papers per year is visually negligible on this scale, appearing as a flat line at or very near zero.
* **~1850 - 1900:** A very slight, barely perceptible rise begins. Values are likely in the low thousands or less per year.
* **~1900 - 1950:** A visible but still modest increase. By 1950, the annual count appears to be in the range of tens of thousands (approx. 0.05e6 to 0.1e6).
* **1950 - 2000:** Growth accelerates significantly.
* ~1970: Approximately 0.5e6 (500,000) papers.
* ~1990: Approximately 1.5e6 to 2e6 (1.5-2 million) papers.
* **2000 - 2023:** Exponential growth phase.
* ~2005: Crosses the 4e6 (4 million) mark.
* ~2010: Reaches approximately 6e6 (6 million).
* **Peak (~2020-2022):** The highest bars appear just before the end of the series, reaching close to or slightly above 9e6 (9 million) papers per year.
* **2023 (Final Bar):** The last bar is slightly shorter than the peak, suggesting a value around 8.5e6. This may indicate incomplete data for the most recent year at the time of chart creation.
### Key Observations
1. **Exponential Growth:** The most dominant feature is the hockey-stick curve, indicating that the rate of scientific publication has itself been increasing exponentially for several decades.
2. **Historical Baseline:** For over 200 years (1684-~1900), the annual output was minuscule compared to modern volumes, reflecting the smaller scale of the formal scientific community.
3. **Inflection Points:** Notable acceleration begins around the early 20th century and again, more dramatically, around the 1960s-1970s.
4. **Recent Peak and Dip:** The peak in the early 2020s followed by a slight dip in 2023 is a notable short-term feature, potentially an artifact of data collection lag.
### Interpretation
This chart is a powerful visualization of the "knowledge explosion." It quantitatively demonstrates the massive and accelerating expansion of human scientific endeavor over the past century. The data suggests several underlying factors:
* **Institutional Growth:** The proliferation of universities, research institutes, and funding bodies globally.
* **Technological Enablement:** Advances in communication (internet, digital publishing), laboratory equipment, and data processing have lowered barriers to conducting and publishing research.
* **Population and Economic Growth:** A larger global population and increased GDP dedicated to R&D.
* **Cultural Shift:** The increasing emphasis on publication as a metric for academic career progression ("publish or perish").
The near-zero baseline for centuries underscores how recent this explosion is in the context of recorded history. The steepness of the curve in recent decades raises questions about sustainability, information overload, and the quality versus quantity of research output. The slight dip in 2023 is likely not a reversal of the trend but a data artifact, as compiling global publication statistics for the most recent year is often incomplete.