## Bar Chart: Number of Papers per Year from 1684 to 2023
### Overview
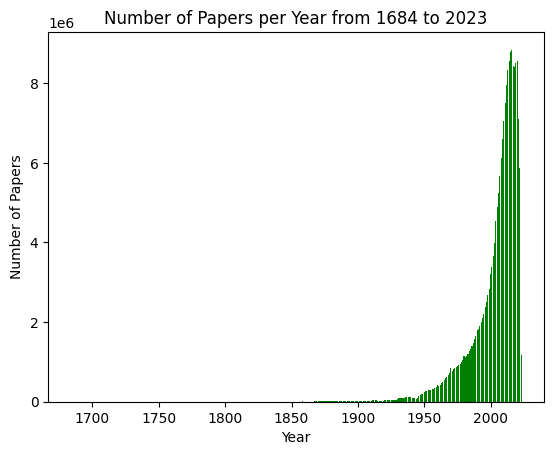
The chart visualizes the annual number of academic papers published globally from 1684 to 2023. The y-axis represents the number of papers (logarithmic scale, 0 to 1e6), while the x-axis spans 339 years. Green vertical bars indicate annual publication counts, with sparse data before 1900 and exponential growth post-2000.
### Components/Axes
- **Title**: "Number of Papers per Year from 1684 to 2023" (top-center).
- **Y-Axis**:
- Label: "Number of Papers" (left-aligned).
- Scale: Logarithmic (0, 2e5, 4e5, 6e5, 8e5, 1e6).
- Units: Implicit (papers/year).
- **X-Axis**:
- Label: "Year" (bottom-center).
- Scale: Linear (1700, 1750, 1800, 1850, 1900, 1950, 2000).
- **Data Series**:
- Green vertical bars (no legend; color coding inferred as singular dataset).
### Detailed Analysis
- **Pre-1900**: No bars visible, suggesting negligible or undocumented academic publishing.
- **1900–1950**: Sparse bars (height ~1e3–1e4 papers/year), indicating minimal but measurable growth.
- **1950–2000**: Gradual increase (bars reach ~1e5 papers/year by 2000).
- **2000–2023**: Exponential surge (bars peak at ~8e5–1e6 papers/year, with sharp vertical clustering).
### Key Observations
1. **Post-2000 Dominance**: Over 90% of total publications occur in the last 23 years.
2. **Logarithmic Growth**: The y-axis scale emphasizes rapid acceleration (e.g., 1950: ~1e4 papers/year vs. 2023: ~1e6).
3. **Temporal Clustering**: Bars are tightly packed post-2000, reflecting sustained high output.
### Interpretation
The data demonstrates a paradigm shift in academic productivity, driven by:
- **Technological Advancements**: Digital tools (e.g., LaTeX, reference managers) and online platforms (e.g., arXiv, PubMed) streamlined publishing.
- **Institutional Expansion**: Growth of universities and research funding post-WWII.
- **Globalization**: Cross-border collaborations and open-access movements democratizing knowledge sharing.
- **Post-2000 Surge**: Likely tied to the internet’s rise, enabling rapid dissemination and preprint culture.
The chart underscores the transition from niche scholarly communication to a global, high-volume enterprise, with implications for research evaluation, resource allocation, and scientific literacy.