\n
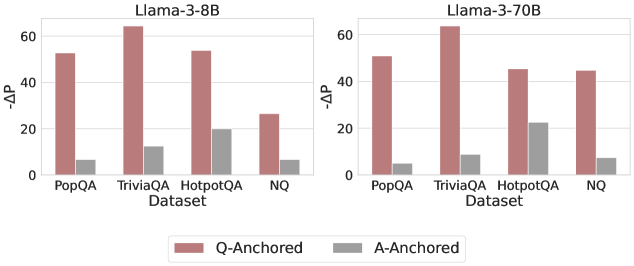
## Bar Chart: Performance Comparison of Llama-3 Models
### Overview
This image presents a bar chart comparing the performance of two Llama-3 models (8B and 70B) across four datasets: PopQA, TriviaQA, HotpotQA, and NQ. The performance metric is represented by "-ΔP", which likely indicates a change in probability or performance score. The chart uses paired bars for each dataset, representing "Q-Anchored" and "A-Anchored" conditions.
### Components/Axes
* **X-axis:** "Dataset" with categories: PopQA, TriviaQA, HotpotQA, NQ.
* **Y-axis:** "-ΔP" with a scale ranging from 0 to 60, incrementing by 10.
* **Models:** Two separate charts are presented side-by-side, one for "Llama-3-8B" and one for "Llama-3-70B".
* **Legend:** Located at the bottom-center of the image.
* "Q-Anchored" (represented by a reddish-brown color)
* "A-Anchored" (represented by a gray color)
### Detailed Analysis
The chart consists of two sets of four paired bar graphs.
**Llama-3-8B:**
* **PopQA:** Q-Anchored is approximately 52, A-Anchored is approximately 8.
* **TriviaQA:** Q-Anchored is approximately 62, A-Anchored is approximately 12.
* **HotpotQA:** Q-Anchored is approximately 48, A-Anchored is approximately 22.
* **NQ:** Q-Anchored is approximately 28, A-Anchored is approximately 6.
**Llama-3-70B:**
* **PopQA:** Q-Anchored is approximately 48, A-Anchored is approximately 10.
* **TriviaQA:** Q-Anchored is approximately 60, A-Anchored is approximately 8.
* **HotpotQA:** Q-Anchored is approximately 44, A-Anchored is approximately 22.
* **NQ:** Q-Anchored is approximately 44, A-Anchored is approximately 8.
In both models, the Q-Anchored bars are consistently higher than the A-Anchored bars across all datasets. The Q-Anchored bars show a generally decreasing trend from PopQA to NQ, while the A-Anchored bars remain relatively low.
### Key Observations
* The "Q-Anchored" condition consistently outperforms the "A-Anchored" condition for both models across all datasets.
* The 70B model generally shows slightly lower values for Q-Anchored compared to the 8B model on PopQA and HotpotQA, but similar values on TriviaQA and NQ.
* The difference between Q-Anchored and A-Anchored is most pronounced on TriviaQA for both models.
* The A-Anchored values are relatively stable across all datasets for both models.
### Interpretation
The data suggests that the "Q-Anchored" approach leads to significantly better performance than the "A-Anchored" approach for the Llama-3 models on these question answering datasets. The "-ΔP" metric likely represents an improvement in performance, so higher values are better. The consistent outperformance of Q-Anchored suggests that anchoring the model's attention or processing around the question itself is more effective than anchoring it around the answer.
The slight differences between the 8B and 70B models suggest that model size has a limited impact on this particular performance difference. The relatively stable A-Anchored performance indicates that this approach may have a lower bound on its effectiveness. The large performance gap on TriviaQA suggests that this dataset may be particularly sensitive to the anchoring method used.
The term "Anchored" likely refers to a specific technique used during the model's inference process, potentially related to attention mechanisms or input formatting. Further investigation into the meaning of "Q-Anchored" and "A-Anchored" would be necessary to fully understand the implications of these results.