## Bar Chart Comparison: Llama-3 Model Performance (ΔP) Across Datasets
### Overview
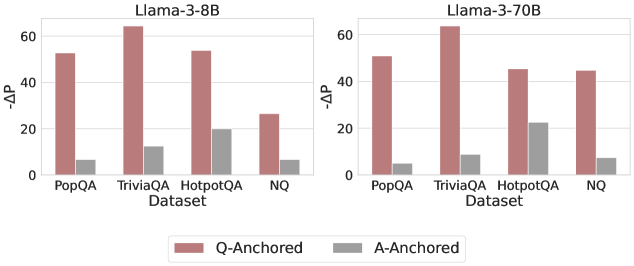
The image displays two side-by-side bar charts comparing the performance (measured as ΔP) of two language models—Llama-3-8B and Llama-3-70B—across four question-answering datasets. Each chart contrasts two evaluation methods: "Q-Anchored" and "A-Anchored."
### Components/Axes
* **Main Titles:** "Llama-3-8B" (left chart), "Llama-3-70B" (right chart).
* **X-Axis (Both Charts):** Labeled "Dataset." Categories are, from left to right: "PopQA", "TriviaQA", "HotpotQA", "NQ".
* **Y-Axis (Both Charts):** Labeled "ΔP". The scale runs from 0 to 60, with major tick marks at 0, 20, 40, and 60.
* **Legend:** Positioned centrally at the bottom, below both charts. It defines two series:
* **Q-Anchored:** Represented by a reddish-brown (terracotta) bar.
* **A-Anchored:** Represented by a gray bar.
* **Chart Structure:** Each dataset category on the x-axis contains a pair of bars: the left (reddish-brown) bar for Q-Anchored and the right (gray) bar for A-Anchored.
### Detailed Analysis
**Llama-3-8B Chart (Left):**
* **PopQA:** Q-Anchored ≈ 52, A-Anchored ≈ 7.
* **TriviaQA:** Q-Anchored ≈ 65 (highest in this chart), A-Anchored ≈ 12.
* **HotpotQA:** Q-Anchored ≈ 54, A-Anchored ≈ 20 (highest A-Anchored value in this chart).
* **NQ:** Q-Anchored ≈ 26 (lowest Q-Anchored value in this chart), A-Anchored ≈ 7.
**Llama-3-70B Chart (Right):**
* **PopQA:** Q-Anchored ≈ 51, A-Anchored ≈ 5.
* **TriviaQA:** Q-Anchored ≈ 63 (highest in this chart), A-Anchored ≈ 9.
* **HotpotQA:** Q-Anchored ≈ 46, A-Anchored ≈ 23 (highest A-Anchored value in this chart).
* **NQ:** Q-Anchored ≈ 45, A-Anchored ≈ 8.
**Trend Verification:**
* In both models, the **Q-Anchored** (reddish-brown) bars are consistently and significantly taller than the **A-Anchored** (gray) bars for every dataset.
* For Q-Anchored, performance peaks on "TriviaQA" in both models.
* For A-Anchored, performance peaks on "HotpotQA" in both models.
### Key Observations
1. **Dominant Performance Gap:** The Q-Anchored method yields a substantially higher ΔP than the A-Anchored method across all four datasets and both model sizes. The gap is often 4-5 times larger.
2. **Dataset Sensitivity:** The magnitude of ΔP varies by dataset. "TriviaQA" consistently shows the highest Q-Anchored performance, while "NQ" shows the lowest for the 8B model but not for the 70B model.
3. **Model Size Effect:** Comparing the two charts:
* The Q-Anchored performance for "NQ" increases dramatically from ~26 (8B) to ~45 (70B).
* Conversely, the Q-Anchored performance for "HotpotQA" decreases from ~54 (8B) to ~46 (70B).
* A-Anchored performance remains relatively low and stable across model sizes, with a slight increase for "HotpotQA" in the 70B model.
### Interpretation
The data strongly suggests that the **Q-Anchored evaluation or training paradigm is far more effective** at achieving a high ΔP score than the A-Anchored paradigm for these question-answering tasks, regardless of model scale (8B vs. 70B parameters). ΔP likely measures some form of performance gain or probability shift, where a higher value is better.
The variation across datasets indicates that task difficulty or nature influences the absolute ΔP scores. The notable increase in Q-Anchored performance on the "NQ" dataset when scaling from 8B to 70B parameters suggests that **larger models may be particularly better at leveraging the Q-Anchored approach for that specific type of knowledge or question format**. The corresponding decrease on "HotpotQA" for the larger model is an interesting counterpoint, possibly indicating a different scaling behavior or dataset characteristic.
The consistently low A-Anchored scores imply this method is either a much weaker baseline or represents a more challenging condition. The fact that its highest point is on "HotpotQA"—a dataset often involving multi-hop reasoning—might suggest A-Anchored performance is less sensitive to simple factual recall and more to complex reasoning, though it still lags far behind Q-Anchored.