## Bar Chart: Performance Comparison of Llama-3-8B and Llama-3-70B Models
### Overview
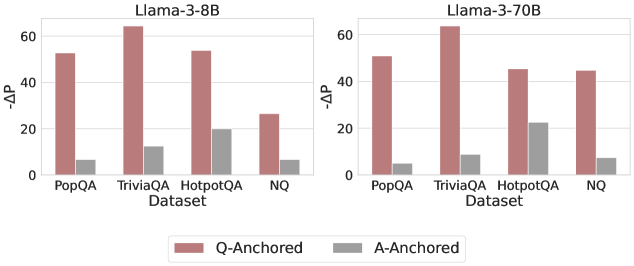
The image contains two side-by-side bar charts comparing the performance of two language models (Llama-3-8B and Llama-3-70B) across four question-answering datasets (PopQA, TriviaQA, HotpotQA, NQ). Performance is measured using the metric "-ΔP" (negative delta P), with two anchoring methods: Q-Anchored (red bars) and A-Anchored (gray bars). The charts highlight differences in performance between model sizes and anchoring strategies.
### Components/Axes
- **X-Axis (Datasets)**: PopQA, TriviaQA, HotpotQA, NQ (categorical, evenly spaced).
- **Y-Axis (-ΔP)**: Numerical scale from 0 to 60 (linear increments of 20).
- **Legend**:
- Red bars = Q-Anchored
- Gray bars = A-Anchored
- **Chart Titles**:
- Left: "Llama-3-8B"
- Right: "Llama-3-70B"
### Detailed Analysis
#### Llama-3-8B Chart
- **PopQA**:
- Q-Anchored ≈ 55
- A-Anchored ≈ 5
- **TriviaQA**:
- Q-Anchored ≈ 65
- A-Anchored ≈ 15
- **HotpotQA**:
- Q-Anchored ≈ 55
- A-Anchored ≈ 20
- **NQ**:
- Q-Anchored ≈ 25
- A-Anchored ≈ 5
#### Llama-3-70B Chart
- **PopQA**:
- Q-Anchored ≈ 50
- A-Anchored ≈ 3
- **TriviaQA**:
- Q-Anchored ≈ 65
- A-Anchored ≈ 25
- **HotpotQA**:
- Q-Anchored ≈ 45
- A-Anchored ≈ 22
- **NQ**:
- Q-Anchored ≈ 45
- A-Anchored ≈ 5
### Key Observations
1. **Q-Anchored Dominance**: Q-Anchored consistently outperforms A-Anchored across all datasets and models (e.g., TriviaQA: 65 vs. 15 for Llama-3-8B).
2. **Model Size Impact**: Llama-3-70B generally matches or exceeds Llama-3-8B performance, except in NQ where both models show similar Q-Anchored results (~25 vs. ~45).
3. **A-Anchored Variability**: A-Anchored performance varies significantly by dataset, with TriviaQA showing the highest gains (~25 for Llama-3-70B).
4. **NQ Anomaly**: NQ dataset has the lowest Q-Anchored performance for Llama-3-8B (~25) but matches Llama-3-70B (~45), suggesting dataset-specific challenges.
### Interpretation
The data demonstrates that Q-Anchored methods are more effective than A-Anchored across both models, with TriviaQA being the strongest performer for Q-Anchored. The larger Llama-3-70B model shows improved performance in most cases, particularly in HotpotQA and NQ, where it closes the gap with the smaller model. However, the NQ dataset presents an outlier: Llama-3-8B underperforms in Q-Anchored but matches Llama-3-70B, indicating potential dataset-specific limitations for the larger model. The A-Anchored method’s performance is more volatile, with TriviaQA showing disproportionately higher gains for the 70B model, suggesting anchoring strategy interacts with dataset complexity. These trends highlight the importance of model size and anchoring method selection for optimal QA performance.