## Line Graphs: Throughput and Packet Delay vs. Simulation Time
### Overview
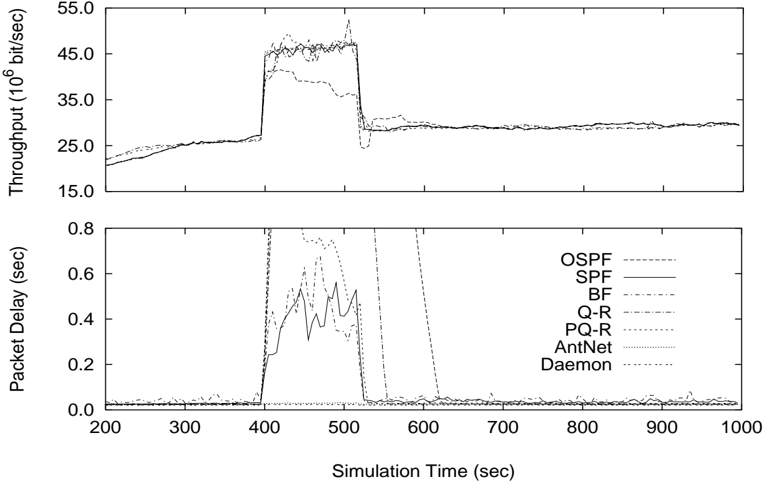
The image contains two line graphs plotted above each other, sharing a common x-axis representing simulation time. The top graph displays throughput (in 10^6 bits/sec) versus simulation time (in seconds), while the bottom graph shows packet delay (in seconds) versus simulation time (in seconds). Several routing protocols are compared across both graphs, with a legend provided to distinguish them.
### Components/Axes
**Top Graph (Throughput):**
* **Y-axis Title:** Throughput (10^6 bit/sec)
* **Y-axis Scale:** 15.0 to 55.0, with increments of 10.0
* **X-axis:** Shared with the bottom graph (Simulation Time (sec))
**Bottom Graph (Packet Delay):**
* **Y-axis Title:** Packet Delay (sec)
* **Y-axis Scale:** 0.0 to 0.8, with increments of 0.2
* **X-axis Title:** Simulation Time (sec)
* **X-axis Scale:** 200 to 1000, with increments of 100
**Legend (Located on the right side of the bottom graph):**
* OSPF (Dashed line)
* SPF (Solid line)
* BF (Dotted-dashed line)
* Q-R (Dotted line)
* PQ-R (Dashed-double dotted line)
* AntNet (Light solid line)
* Daemon (Dashed line with larger dashes)
### Detailed Analysis
**Top Graph (Throughput):**
* **OSPF (Dashed line):** Starts at approximately 23 x 10^6 bit/sec, gradually increases to around 26 x 10^6 bit/sec by 400 seconds. It then sharply increases to approximately 38 x 10^6 bit/sec, plateaus until 500 seconds, and then drops back down to around 27 x 10^6 bit/sec, where it remains relatively stable.
* **SPF (Solid line):** Starts at approximately 23 x 10^6 bit/sec, gradually increases to around 26 x 10^6 bit/sec by 400 seconds. It then sharply increases to approximately 45 x 10^6 bit/sec, plateaus until 500 seconds, and then drops back down to around 27 x 10^6 bit/sec, where it remains relatively stable.
* **BF (Dotted-dashed line):** Starts at approximately 23 x 10^6 bit/sec, gradually increases to around 26 x 10^6 bit/sec by 400 seconds. It then sharply increases to approximately 47 x 10^6 bit/sec, plateaus until 500 seconds, and then drops back down to around 27 x 10^6 bit/sec, where it remains relatively stable.
* **Q-R (Dotted line):** Starts at approximately 23 x 10^6 bit/sec, gradually increases to around 26 x 10^6 bit/sec by 400 seconds. It then sharply increases to approximately 47 x 10^6 bit/sec, plateaus until 500 seconds, and then drops back down to around 27 x 10^6 bit/sec, where it remains relatively stable.
* **PQ-R (Dashed-double dotted line):** Starts at approximately 23 x 10^6 bit/sec, gradually increases to around 26 x 10^6 bit/sec by 400 seconds. It then sharply increases to approximately 46 x 10^6 bit/sec, plateaus until 500 seconds, and then drops back down to around 27 x 10^6 bit/sec, where it remains relatively stable.
* **AntNet (Light solid line):** Starts at approximately 23 x 10^6 bit/sec, gradually increases to around 26 x 10^6 bit/sec by 400 seconds. It then sharply increases to approximately 45 x 10^6 bit/sec, plateaus until 500 seconds, and then drops back down to around 27 x 10^6 bit/sec, where it remains relatively stable.
* **Daemon (Dashed line with larger dashes):** Starts at approximately 23 x 10^6 bit/sec, gradually increases to around 26 x 10^6 bit/sec by 400 seconds. It then sharply increases to approximately 40 x 10^6 bit/sec, plateaus until 500 seconds, and then drops back down to around 27 x 10^6 bit/sec, where it remains relatively stable.
**Bottom Graph (Packet Delay):**
* **OSPF (Dashed line):** Remains relatively stable at approximately 0.02 sec until 400 seconds, then sharply increases to approximately 0.8 sec, and returns to approximately 0.02 sec after 600 seconds.
* **SPF (Solid line):** Remains relatively stable at approximately 0.02 sec until 400 seconds, then sharply increases to approximately 0.7 sec, and returns to approximately 0.02 sec after 600 seconds.
* **BF (Dotted-dashed line):** Remains relatively stable at approximately 0.02 sec until 400 seconds, then increases with fluctuations to approximately 0.6 sec at 500 seconds, and returns to approximately 0.02 sec after 600 seconds.
* **Q-R (Dotted line):** Remains relatively stable at approximately 0.02 sec until 400 seconds, then increases with fluctuations to approximately 0.5 sec at 500 seconds, and returns to approximately 0.02 sec after 600 seconds.
* **PQ-R (Dashed-double dotted line):** Remains relatively stable at approximately 0.02 sec until 400 seconds, then increases with fluctuations to approximately 0.5 sec at 500 seconds, and returns to approximately 0.02 sec after 600 seconds.
* **AntNet (Light solid line):** Remains relatively stable at approximately 0.02 sec until 400 seconds, then increases with fluctuations to approximately 0.5 sec at 500 seconds, and returns to approximately 0.02 sec after 600 seconds.
* **Daemon (Dashed line with larger dashes):** Remains relatively stable at approximately 0.02 sec until 400 seconds, then sharply increases to approximately 0.8 sec, and returns to approximately 0.02 sec after 600 seconds.
### Key Observations
* All protocols exhibit a significant increase in throughput between 400 and 500 seconds of simulation time.
* Correspondingly, all protocols experience a spike in packet delay between 400 and 600 seconds.
* The throughput values are very similar across all protocols, both before, during, and after the spike.
* The packet delay values vary more significantly between protocols during the spike, with OSPF and Daemon showing the highest delay.
### Interpretation
The graphs illustrate the performance of different routing protocols under a simulated network condition. The simultaneous increase in throughput and packet delay suggests a period of network congestion or a significant change in traffic patterns around the 400-second mark. The protocols appear to recover to their initial performance levels after approximately 600 seconds. The differences in packet delay during the congestion period may indicate varying levels of efficiency in handling the increased traffic load among the different protocols. The similarity in throughput suggests that all protocols are ultimately able to deliver the data, but the delay differences highlight potential trade-offs in latency.