\n
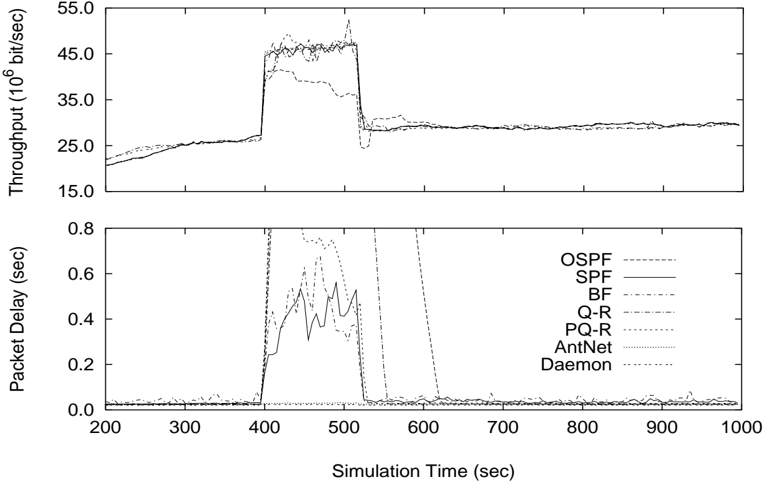
## Line Chart: Network Performance Comparison
### Overview
The image presents two line charts displaying network performance metrics – Throughput and Packet Delay – over Simulation Time. The top chart shows Throughput in (10^6 bit/sec) and the bottom chart shows Packet Delay in (sec). Both charts compare the performance of several routing protocols: OSPF, SPF, BF, Q-R, PQ-R, AntNet, and Daemon.
### Components/Axes
* **X-axis (Both Charts):** Simulation Time (sec), ranging from 200 to 1000 seconds.
* **Y-axis (Top Chart):** Throughput (10^6 bit/sec), ranging from 15 to 55.
* **Y-axis (Bottom Chart):** Packet Delay (sec), ranging from 0 to 0.8.
* **Legend (Bottom-Right):** Lists the routing protocols being compared:
* OSPF (Solid Black Line)
* SPF (Solid Grey Line)
* BF (Dashed Black Line)
* Q-R (Dashed Grey Line)
* PQ-R (Dotted Black Line)
* AntNet (Dotted Grey Line)
* Daemon (Dash-Dot Black Line)
### Detailed Analysis or Content Details
**Top Chart - Throughput:**
* **OSPF:** Starts at approximately 25 (10^6 bit/sec), remains relatively stable until around 400 seconds, then rapidly increases to approximately 48 (10^6 bit/sec). It then fluctuates between 45 and 48 (10^6 bit/sec) until around 550 seconds, after which it drops to approximately 25 (10^6 bit/sec) and remains stable.
* **SPF:** Starts at approximately 25 (10^6 bit/sec), remains relatively stable until around 400 seconds, then rapidly increases to approximately 46 (10^6 bit/sec). It then fluctuates between 43 and 46 (10^6 bit/sec) until around 550 seconds, after which it drops to approximately 25 (10^6 bit/sec) and remains stable.
* **BF:** Starts at approximately 25 (10^6 bit/sec) and remains relatively stable throughout the simulation, with minor fluctuations.
* **Q-R:** Starts at approximately 25 (10^6 bit/sec) and remains relatively stable throughout the simulation, with minor fluctuations.
* **PQ-R:** Starts at approximately 25 (10^6 bit/sec) and remains relatively stable throughout the simulation, with minor fluctuations.
* **AntNet:** Starts at approximately 25 (10^6 bit/sec) and remains relatively stable throughout the simulation, with minor fluctuations.
* **Daemon:** Starts at approximately 25 (10^6 bit/sec) and remains relatively stable throughout the simulation, with minor fluctuations.
**Bottom Chart - Packet Delay:**
* **OSPF:** Remains near 0 sec until approximately 400 seconds, then rapidly increases to approximately 0.6 sec, fluctuates significantly between 0.3 and 0.6 sec until approximately 600 seconds, and then drops back to near 0 sec.
* **SPF:** Remains near 0 sec until approximately 400 seconds, then rapidly increases to approximately 0.5 sec, fluctuates significantly between 0.2 and 0.5 sec until approximately 600 seconds, and then drops back to near 0 sec.
* **BF:** Remains near 0 sec throughout the simulation, with very minor fluctuations.
* **Q-R:** Remains near 0 sec throughout the simulation, with very minor fluctuations.
* **PQ-R:** Remains near 0 sec throughout the simulation, with very minor fluctuations.
* **AntNet:** Remains near 0 sec throughout the simulation, with very minor fluctuations.
* **Daemon:** Remains near 0 sec throughout the simulation, with very minor fluctuations.
### Key Observations
* OSPF and SPF exhibit a significant increase in both throughput and packet delay around 400 seconds, followed by a return to initial levels around 550-600 seconds. This suggests a transient event or change in network conditions at that time.
* BF, Q-R, PQ-R, AntNet, and Daemon maintain relatively stable performance throughout the simulation, with low packet delay and consistent throughput.
* The throughput of OSPF and SPF is significantly higher than the other protocols during the peak period (400-550 seconds).
* The packet delay for OSPF and SPF is significantly higher than the other protocols during the peak period (400-600 seconds).
### Interpretation
The data suggests that OSPF and SPF protocols are more sensitive to changes in network conditions than the other protocols. While they can achieve higher throughput under certain circumstances, they also experience a significant increase in packet delay during those periods. This could indicate that OSPF and SPF are more prone to congestion or require more resources to adapt to changing network conditions.
The stable performance of BF, Q-R, PQ-R, AntNet, and Daemon suggests that they are more robust and less susceptible to transient events. However, their throughput is consistently lower than that of OSPF and SPF during the peak period.
The transient event around 400 seconds likely represents a change in network load or topology. The increase in throughput for OSPF and SPF suggests that they were able to adapt to the new conditions and utilize available bandwidth. However, the corresponding increase in packet delay indicates that this adaptation came at the cost of increased latency.
The relationship between throughput and packet delay is a classic trade-off in network design. OSPF and SPF appear to prioritize throughput, while the other protocols prioritize low latency. The optimal choice of protocol depends on the specific requirements of the network.