## Line Chart: Network Protocol Performance Metrics
### Overview
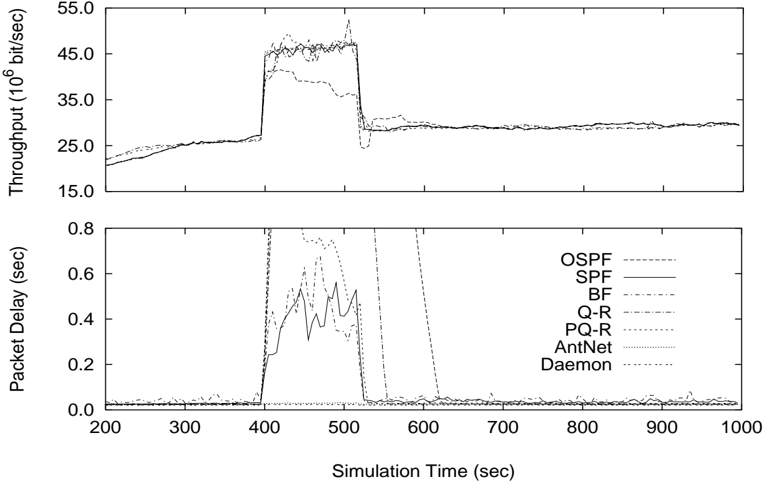
The image contains two line graphs comparing the performance of various network routing protocols over simulation time. The top graph measures **Throughput (10⁶ bit/sec)**, while the bottom graph measures **Packet Delay (sec)**. The x-axis represents **Simulation Time (sec)** from 200 to 1000 seconds. Seven protocols are compared: OSPF, SPF, BF, Q-R, PQ-R, AntNet, and Daemon, each represented by distinct line styles.
---
### Components/Axes
- **X-axis (Simulation Time)**: Labeled "Simulation Time (sec)" with ticks at 200, 300, 400, 500, 600, 700, 800, 900, and 1000 seconds.
- **Y-axis (Top Graph)**: Labeled "Throughput (10⁶ bit/sec)" with values from 15.0 to 55.0.
- **Y-axis (Bottom Graph)**: Labeled "Packet Delay (sec)" with values from 0.0 to 0.8.
- **Legend**: Located on the right side of the chart, associating line styles with protocols:
- **OSPF**: Dotted line
- **SPF**: Solid line
- **BF**: Dashed line
- **Q-R**: Dotted line
- **PQ-R**: Dotted line
- **AntNet**: Dotted line
- **Daemon**: Dotted line
---
### Detailed Analysis
#### Top Graph (Throughput)
- **OSPF (Dotted)**: Peaks at ~45.0 × 10⁶ bit/sec around 400s, then drops sharply to ~25.0 × 10⁶ bit/sec at 500s, stabilizing afterward.
- **SPF (Solid)**: Shows a similar peak to OSPF but with a slightly smoother decline, maintaining ~25.0 × 10⁶ bit/sec after 500s.
- **BF (Dashed)**: Remains flat at ~20.0 × 10⁶ bit/sec throughout the simulation.
- **Q-R (Dotted)**: Peaks at ~30.0 × 10⁶ bit/sec at 400s, then drops to ~15.0 × 10⁶ bit/sec at 500s.
- **PQ-R (Dotted)**: Similar to Q-R but with a less pronounced drop, stabilizing at ~20.0 × 10⁶ bit/sec.
- **AntNet (Dotted)**: Flat at ~10.0 × 10⁶ bit/sec.
- **Daemon (Dotted)**: Flat at ~5.0 × 10⁶ bit/sec.
#### Bottom Graph (Packet Delay)
- **OSPF (Dotted)**: Spikes to ~0.6 sec at 400s, then drops to ~0.2 sec at 500s, remaining stable.
- **SPF (Solid)**: Similar spike to OSPF but with a slightly slower decline, stabilizing at ~0.3 sec.
- **BF (Dashed)**: Flat at ~0.1 sec.
- **Q-R (Dotted)**: Spikes to ~0.5 sec at 400s, drops to ~0.3 sec at 500s.
- **PQ-R (Dotted)**: Similar to Q-R but with a slower decline, stabilizing at ~0.25 sec.
- **AntNet (Dotted)**: Flat at ~0.05 sec.
- **Daemon (Dotted)**: Flat at ~0.02 sec.
---
### Key Observations
1. **Performance Variance**: OSPF and SPF exhibit the highest throughput and lowest packet delay, suggesting superior performance.
2. **Spike and Drop**: All protocols show a sharp increase in packet delay and a drop in throughput at 400s, followed by a recovery at 500s. This may indicate a simulated network event (e.g., congestion or failure).
3. **Protocol Differences**: BF, AntNet, and Daemon maintain consistently low throughput and delay, while Q-R and PQ-R show intermediate performance.
4. **Line Style Consistency**: All dotted lines (OSPF, Q-R, PQ-R, AntNet, Daemon) align with their legend labels, confirming accurate data representation.
---
### Interpretation
The data suggests that **OSPF and SPF** are the most efficient protocols in this simulation, balancing high throughput and low delay. The sharp spike in packet delay at 400s and subsequent drop at 500s likely reflects a transient network condition (e.g., a link failure or congestion event). Protocols like BF, AntNet, and Daemon perform poorly in terms of throughput but maintain minimal delay, possibly due to simpler routing mechanisms. The consistent use of line styles in the legend ensures clarity, though the absence of color limits visual distinction. This chart highlights the trade-offs between protocol complexity and performance under dynamic network conditions.