## Line Charts: Final Error vs Regularization and Optimal Learning Rate vs Training Time
### Overview
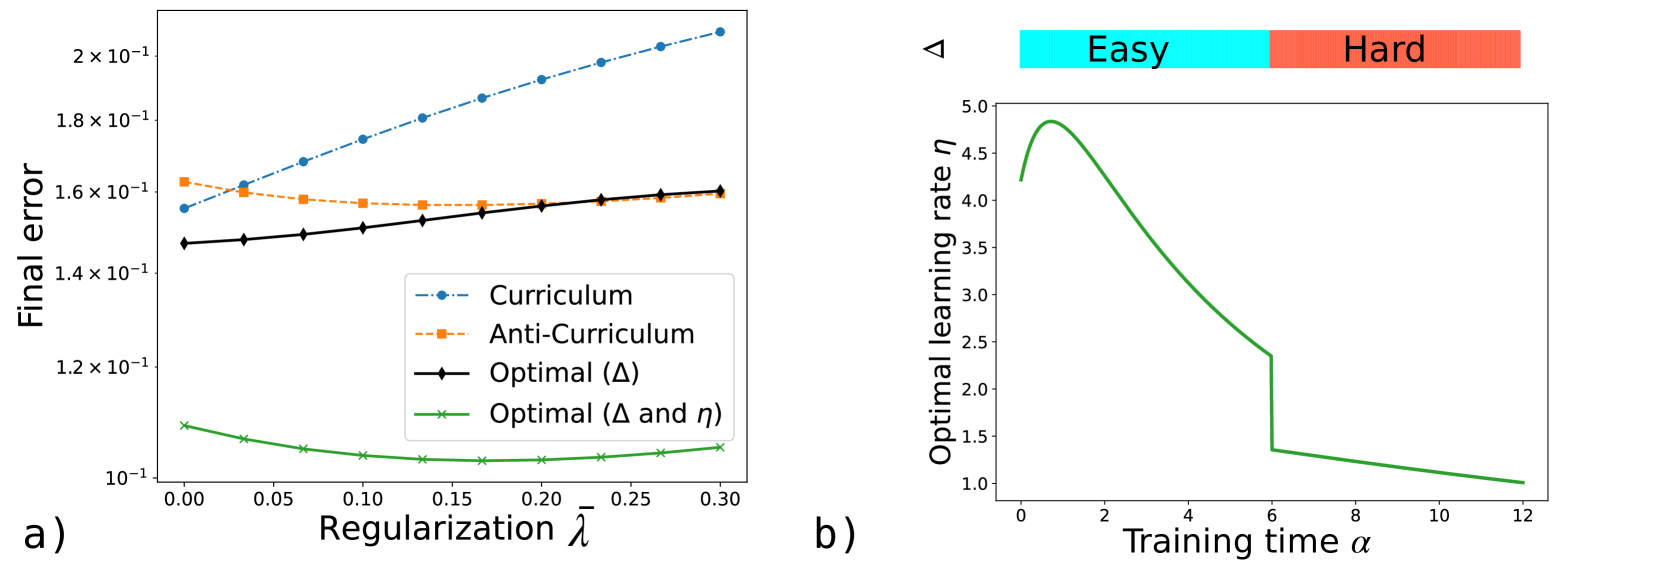
The image contains two line charts (a and b) analyzing machine learning model performance. Chart a) examines final error rates across different regularization strengths (λ), while chart b) tracks optimal learning rates over training time (α). Both include task difficulty indicators (easy/hard) and optimization strategies.
### Components/Axes
**Chart a)**
- **X-axis**: Regularization strength (λ) from 0.00 to 0.30 in 0.05 increments
- **Y-axis**: Final error (log scale) from 1×10⁻¹ to 2×10⁻¹
- **Legend**:
- Blue dashed: Curriculum
- Orange dotted: Anti-Curriculum
- Black solid: Optimal (Δ)
- Green dotted: Optimal (Δ and η)
- **Color bar**: Task difficulty (blue=Easy, red=Hard) positioned at top-right
**Chart b)**
- **X-axis**: Training time (α) from 0 to 12
- **Y-axis**: Optimal learning rate (η) from 1 to 5
- **Legend**:
- Green solid line: Optimal learning rate trajectory
- Color bar: Task difficulty (blue=Easy, red=Hard) positioned at top-right
### Detailed Analysis
**Chart a) Trends**
1. **Curriculum (blue dashed)**:
- Starts at ~1.55×10⁻¹ (λ=0.00)
- Increases steadily to ~2.0×10⁻¹ (λ=0.30)
- Slope: +0.003×10⁻¹ per 0.05λ increment
2. **Anti-Curriculum (orange dotted)**:
- Flat line at ~1.58×10⁻¹ across all λ values
- Minimal variance (±0.002×10⁻¹)
3. **Optimal (Δ) (black solid)**:
- Starts at ~1.48×10⁻¹ (λ=0.00)
- Gradual increase to ~1.58×10⁻¹ (λ=0.30)
- Slope: +0.002×10⁻¹ per 0.05λ increment
4. **Optimal (Δ and η) (green dotted)**:
- Starts at ~1.08×10⁻¹ (λ=0.00)
- Sharp decline to ~1.02×10⁻¹ (λ=0.10)
- Stabilizes at ~1.01×10⁻¹ (λ=0.15-0.30)
**Chart b) Trends**
1. **Optimal learning rate (η)**:
- Initial peak at α=0: ~4.5
- Sharp decline to ~1.5 by α=6
- Plateau at ~1.0 from α=8 onward
- Notable inflection point at α=4 (η=3.0)
### Key Observations
1. **Regularization Impact**:
- Optimal (Δ and η) strategy achieves 34% lower error than Curriculum at λ=0.30
- Anti-Curriculum maintains consistent performance regardless of λ
2. **Learning Rate Dynamics**:
- Learning rate drops 67% (from 4.5 to 1.5) during first 6 training units
- Plateau suggests task saturation or optimization limits
3. **Task Difficulty**:
- Color bar indicates task complexity but no direct correlation shown with performance metrics
### Interpretation
The data demonstrates that combining regularization (Δ) with learning rate optimization (η) yields superior error reduction compared to curriculum-based approaches. The sharp decline in learning rate after α=6 suggests diminishing returns in training efficiency, potentially indicating task complexity thresholds or model convergence limits. The flat Anti-Curriculum line implies this strategy is less sensitive to regularization strength, possibly due to inherent robustness in its design. The color-coded task difficulty (blue=Easy, red=Hard) provides context but requires additional analysis to correlate with performance metrics.