## Line Chart: Im Loss Over Iterations
### Overview
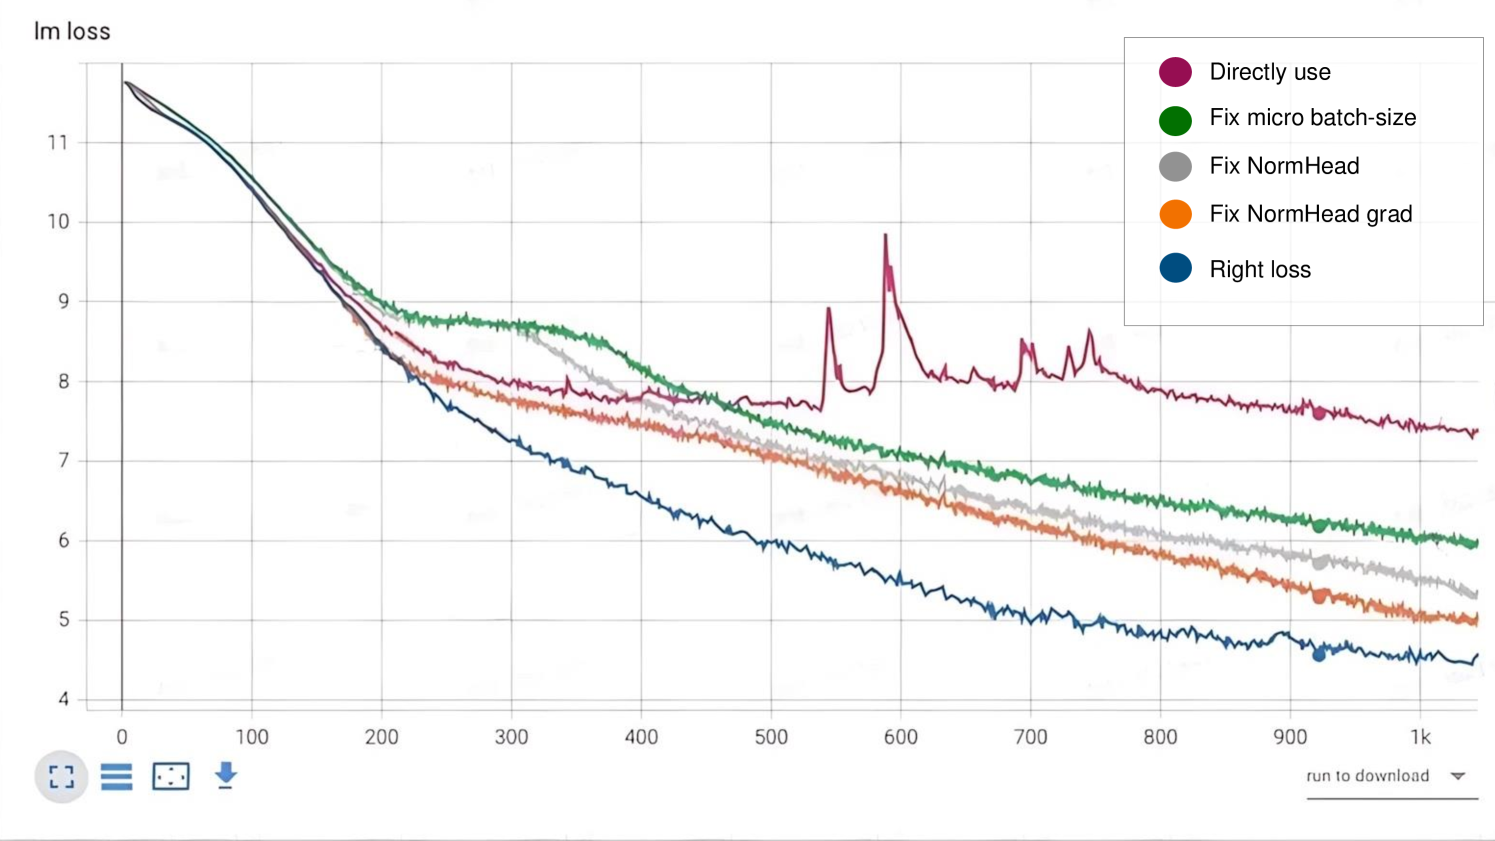
The image displays a line chart titled "Im loss" tracking the evolution of loss values across 1,000 iterations. Five distinct data series are plotted, each representing different experimental conditions or parameters. The y-axis measures loss magnitude (4–11), while the x-axis represents iteration count (0–1,000). The chart includes grid lines, a legend, and a download button.
### Components/Axes
- **Y-axis**: Labeled "Im loss" with linear scale (4–11).
- **X-axis**: Unlabeled, with iteration markers (0, 100, 200, ..., 1,000).
- **Legend**: Located in the top-right corner, mapping colors to conditions:
- Magenta: "Directly use"
- Green: "Fix micro batch-size"
- Gray: "Fix NormHead"
- Orange: "Fix NormHead grad"
- Blue: "Right loss"
- **Grid**: Black grid lines for reference.
- **Download Button**: Located at the bottom-right corner.
### Detailed Analysis
1. **Magenta ("Directly use")**:
- Starts at ~11.5 (iteration 0), drops sharply to ~8.5 by iteration 100.
- Exhibits volatility after iteration 500, with spikes (e.g., ~9.5 at iteration 600).
- Ends at ~7.5 (iteration 1,000).
2. **Green ("Fix micro batch-size")**:
- Begins at ~11.5, declines steadily to ~6.5 by iteration 1,000.
- Smoother trajectory compared to magenta, with minor fluctuations.
3. **Gray ("Fix NormHead")**:
- Starts at ~11.5, decreases to ~6.0 by iteration 1,000.
- Shows moderate fluctuations, particularly between iterations 300–500.
4. **Orange ("Fix NormHead grad")**:
- Begins at ~11.5, declines to ~5.5 by iteration 1,000.
- Smoother than gray, with fewer fluctuations.
5. **Blue ("Right loss")**:
- Starts at ~11.5, decreases steadily to ~4.5 by iteration 1,000.
- Most consistent decline with minimal fluctuations.
### Key Observations
- All lines show an initial sharp decline (iterations 0–100), suggesting rapid improvement in early training.
- "Directly use" (magenta) exhibits the highest volatility post-iteration 500, with notable spikes.
- "Right loss" (blue) demonstrates the most stable and consistent improvement.
- "Fix NormHead grad" (orange) achieves the lowest final loss (~5.5), outperforming other methods.
### Interpretation
The data suggests that parameter adjustments ("Fix micro batch-size," "Fix NormHead grad") improve loss reduction compared to the baseline ("Directly use"). The "Right loss" method shows the most stable convergence, indicating potential robustness. The magenta line's spikes may reflect instability in the "Directly use" approach, possibly due to unoptimized hyperparameters. The consistent decline across all methods highlights the effectiveness of iterative training, with parameter tuning further enhancing performance.