## Chart: Metric Values vs. Lambda (λ)
### Overview
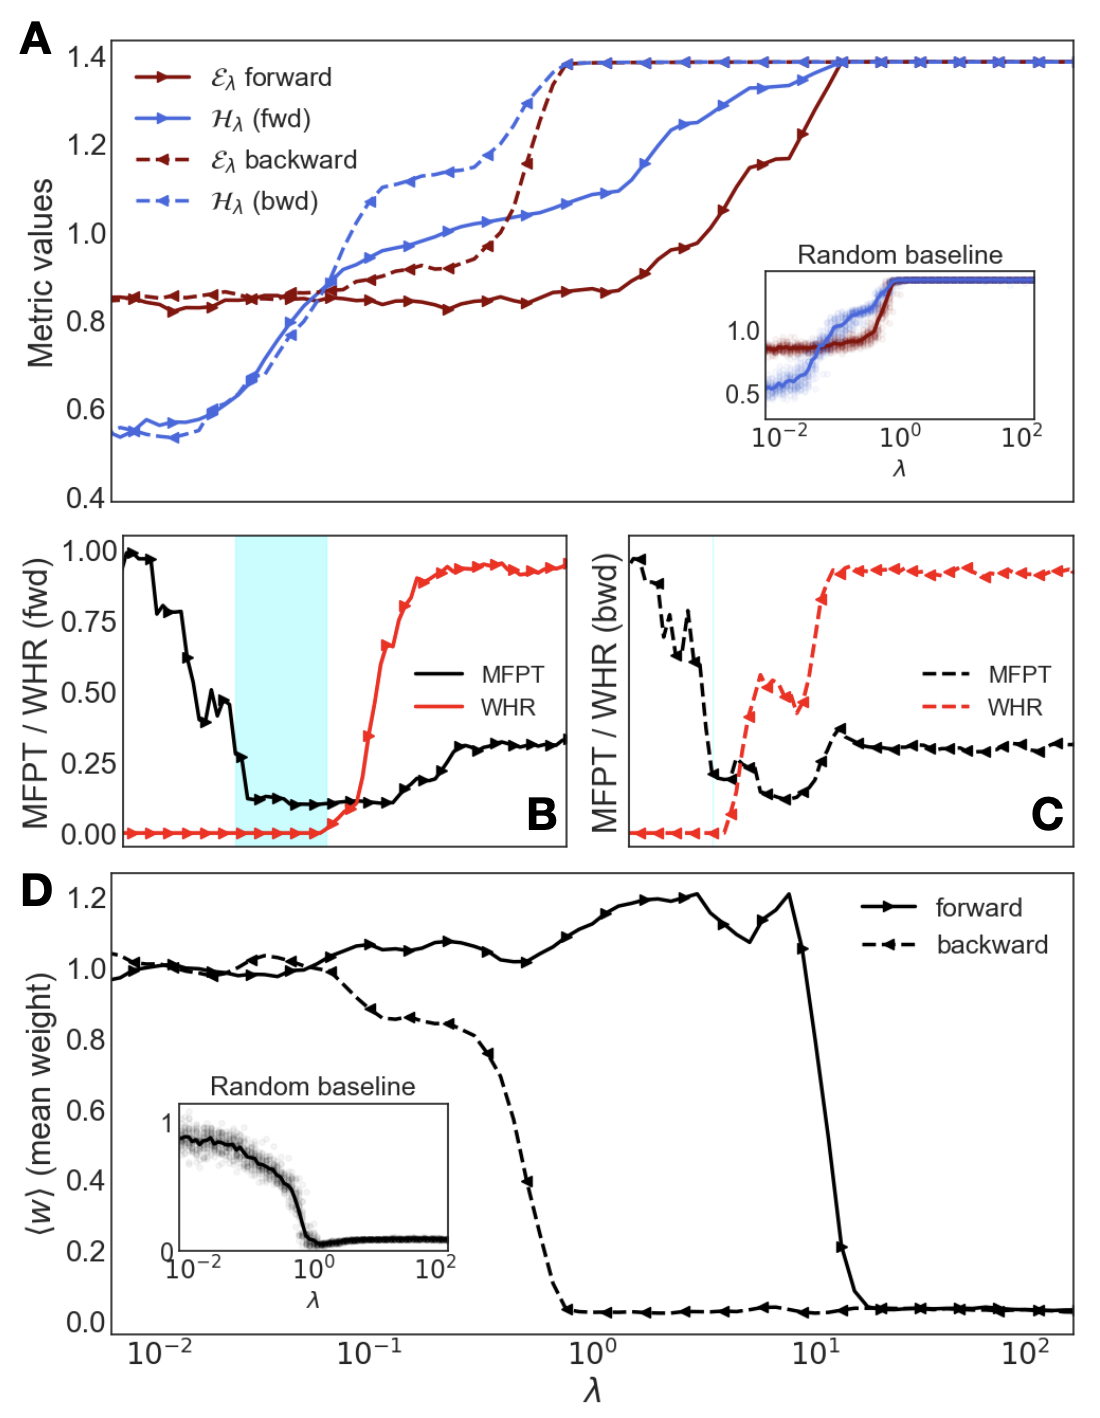
The image presents four charts (A, B, C, and D) illustrating relationships between various metrics and a parameter denoted as lambda (λ). The charts appear to analyze forward and backward dynamics of certain quantities, potentially in a network or system. Each chart focuses on different metrics, and a "Random baseline" is included for comparison in charts A and D.
### Components/Axes
* **Chart A:**
* X-axis: λ (lambda), logarithmic scale from 10<sup>-2</sup> to 10<sup>2</sup>.
* Y-axis: Metric values, ranging from approximately 0.6 to 1.4.
* Lines:
* ε<sub>λ</sub> forward (solid black line with triangle markers)
* H<sub>λ</sub> (fwd) (solid blue line with circle markers)
* ε<sub>λ</sub> backward (dashed red line with triangle markers)
* H<sub>λ</sub> (bwd) (dashed blue line with square markers)
* Inset: A smaller chart showing the Random baseline, with λ on the x-axis and a value between 0.5 and 1.0 on the y-axis.
* **Chart B:**
* X-axis: Not explicitly labeled, but appears to represent a sequence of steps or iterations.
* Y-axis: MFPT / WHR (fwd), ranging from approximately 0.0 to 1.0.
* Lines:
* MFPT (solid black line)
* WHR (solid red line)
* **Chart C:**
* X-axis: Not explicitly labeled, but appears to represent a sequence of steps or iterations.
* Y-axis: MFPT / WHR (bwd), ranging from approximately 0.0 to 1.0.
* Lines:
* MFPT (dashed black line)
* WHR (dashed red line)
* **Chart D:**
* X-axis: λ (lambda), logarithmic scale from 10<sup>-2</sup> to 10<sup>2</sup>.
* Y-axis: w (mean weight), ranging from approximately 0.0 to 1.2.
* Lines:
* forward (solid black line)
* backward (dashed black line)
* Inset: A smaller chart showing the Random baseline, with λ on the x-axis and a value between 0.4 and 1.0 on the y-axis.
### Detailed Analysis or Content Details
* **Chart A:**
* ε<sub>λ</sub> forward: Starts at approximately 0.75, increases steadily to around 1.35 at λ = 10<sup>1</sup>, then plateaus.
* H<sub>λ</sub> (fwd): Starts at approximately 0.7, increases to around 1.2 at λ = 10<sup>0</sup>, then plateaus.
* ε<sub>λ</sub> backward: Starts at approximately 0.8, decreases to around 0.7 at λ = 10<sup>-1</sup>, then increases to around 1.1 at λ = 10<sup>1</sup>, then plateaus.
* H<sub>λ</sub> (bwd): Starts at approximately 0.65, decreases to around 0.6 at λ = 10<sup>-1</sup>, then increases to around 1.0 at λ = 10<sup>1</sup>, then plateaus.
* **Chart B:**
* MFPT: Starts at approximately 0.25, fluctuates significantly, reaching a peak around 0.9 at step 10, then decreases to around 0.4.
* WHR: Starts at approximately 0.7, decreases to around 0.3 at step 5, then increases to around 0.7.
* **Chart C:**
* MFPT: Starts at approximately 0.8, fluctuates significantly, reaching a peak around 0.9 at step 5, then decreases to around 0.3.
* WHR: Starts at approximately 0.2, increases to around 0.7 at step 10, then decreases to around 0.4.
* **Chart D:**
* forward: Starts at approximately 1.0, decreases sharply to around 0.1 at λ = 10<sup>0</sup>, then increases slightly to around 0.2 at λ = 10<sup>1</sup>, then increases sharply to around 1.0 at λ = 10<sup>2</sup>.
* backward: Starts at approximately 1.0, remains relatively stable around 0.2 across the entire range of λ.
### Key Observations
* In Chart A, both forward metrics (ε<sub>λ</sub> and H<sub>λ</sub>) increase with λ until they plateau. The backward metrics show a more complex behavior, initially decreasing before increasing.
* Charts B and C show highly oscillatory behavior for both MFPT and WHR, suggesting dynamic changes in these quantities.
* Chart D shows a dramatic shift in the forward metric's behavior around λ = 10<sup>0</sup>, while the backward metric remains relatively constant.
* The Random baseline in Charts A and D provides a reference point for assessing the significance of the observed trends.
### Interpretation
The data suggests an investigation into the effects of a parameter λ on various metrics within a system. The forward and backward analyses indicate directional dependencies, with different behaviors observed depending on the direction of the process. The oscillatory behavior in Charts B and C suggests a complex interplay between MFPT and WHR, potentially indicating instability or cyclical patterns. The sharp transition in Chart D around λ = 10<sup>0</sup> suggests a critical point or threshold in the system's behavior. The comparison to the random baseline helps to determine whether the observed trends are statistically significant or simply due to chance. The use of both forward and backward dynamics suggests an attempt to understand the system's stability and reversibility. The metrics themselves (ε<sub>λ</sub>, H<sub>λ</sub>, MFPT, WHR, w) are not defined in the image, but their relationships to λ provide insights into the system's underlying mechanisms.