## Composite Chart: Multi-Panel Analysis of Metric Performance Across λ
### Overview
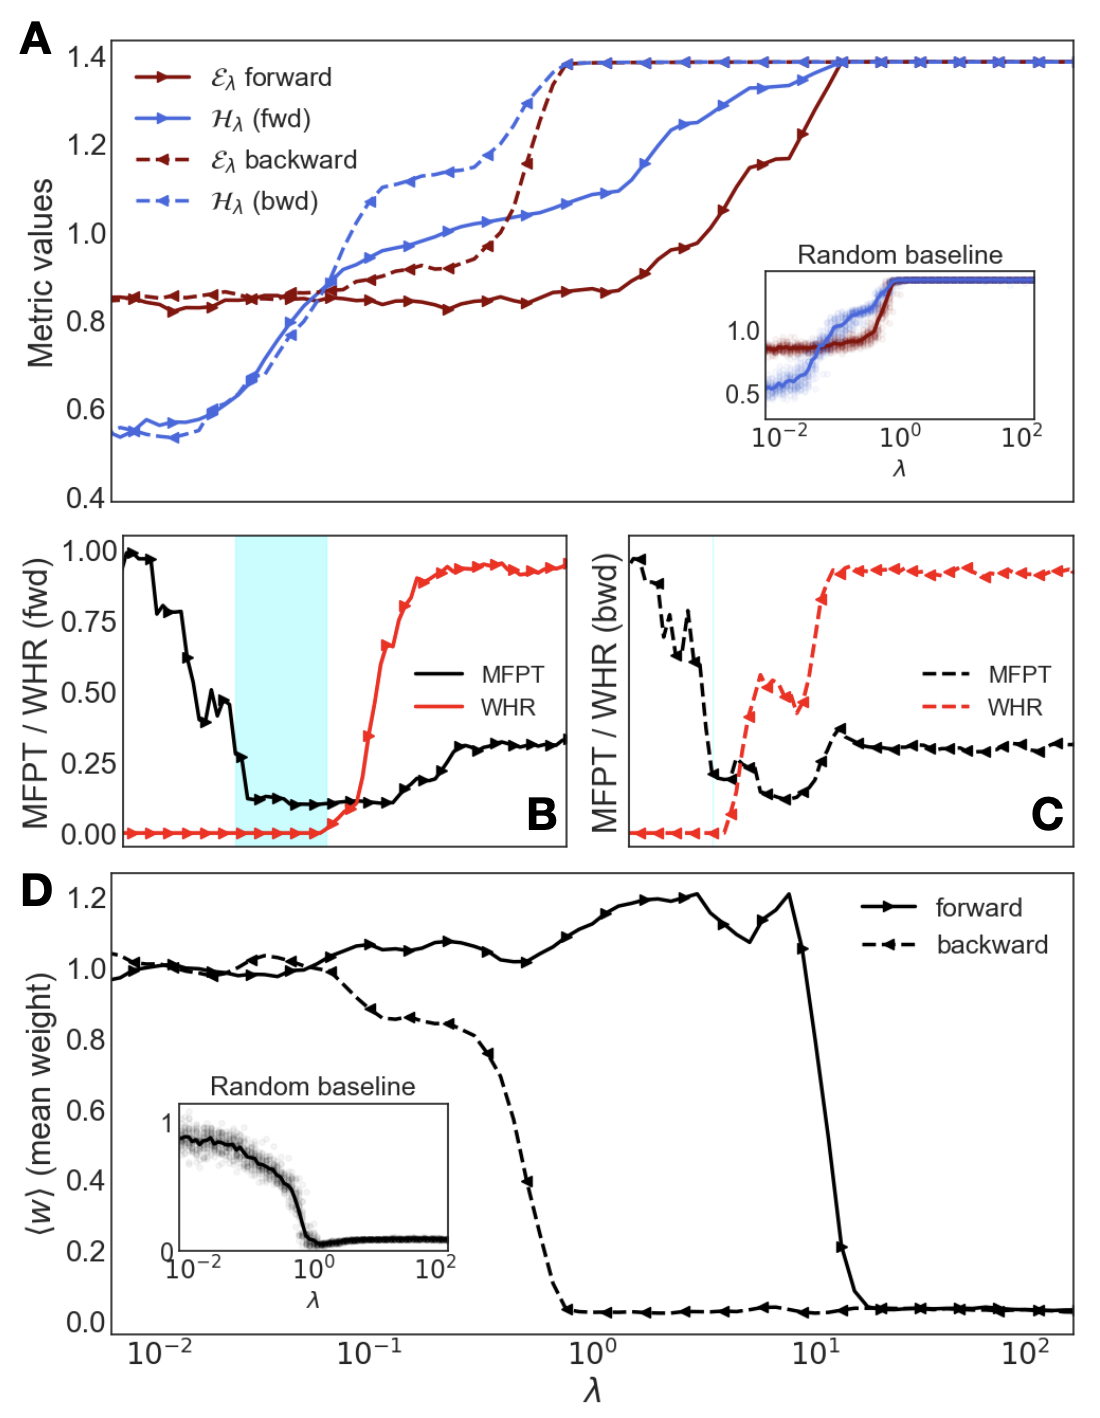
The image presents four panels (A-D) analyzing metric performance across a logarithmic λ scale (10⁻² to 10²). Panels A and D show forward/backward metric trajectories, while B and C compare MFPT/WHR ratios. Insets in A and D display random baseline comparisons.
### Components/Axes
**Panel A:**
- **Y-axis:** Metric values (0.4–1.4)
- **X-axis:** λ (log scale: 10⁻² to 10²)
- **Legends:**
- Solid red: ε_λ forward
- Solid blue: H_λ (fwd)
- Dashed red: ε_λ backward
- Dashed blue: H_λ (bwd)
- **Inset:** Random baseline (blue line with sharp jump at λ=1)
**Panels B/C:**
- **Y-axis:** MFPT/WHR (fwd/bwd) ratios (0–1)
- **X-axis:** λ (log scale)
- **Legends:**
- Solid black: MFPT
- Solid red: WHR
- Dashed black: MFPT (bwd)
- Dashed red: WHR (bwd)
**Panel D:**
- **Y-axis:** Mean weight (0–1.2)
- **X-axis:** λ (log scale)
- **Legends:**
- Solid line: Forward
- Dashed line: Backward
- **Inset:** Random baseline (gradual decline)
### Detailed Analysis
**Panel A:**
- **Forward metrics (ε_λ, H_λ):** Both rise from ~0.8–0.6 (λ=10⁻²) to 1.4 (λ=10²), with H_λ (fwd) showing a steeper initial increase.
- **Backward metrics:** Mirror forward trends but with delayed convergence (ε_λ backward plateaus at ~0.9 before rising).
- **Random baseline inset:** Blue line jumps from 0.5 to 1.0 at λ=1, suggesting threshold behavior.
**Panels B/C:**
- **MFPT (black lines):**
- Panel B: Drops sharply at λ=0.1 (from 1.0 to 0.25), then rises to 0.75 by λ=1.
- Panel C: Drops abruptly at λ=1 (from 1.0 to 0.2), then stabilizes.
- **WHR (red lines):**
- Panel B: Remains near 0 until λ=1, then jumps to 1.0.
- Panel C: Peaks at λ=10 (0.8), then declines to 0.6 by λ=100.
**Panel D:**
- **Forward metric:** Drops from 1.2 (λ=10⁻²) to 0.6 (λ=1), then plunges to 0.2 (λ=10).
- **Backward metric:** Follows similar trajectory but with delayed drop (0.8 at λ=1, 0.4 at λ=10).
- **Random baseline inset:** Gradual decline from 1.0 to 0.4 over λ=10⁻² to 10².
### Key Observations
1. **Convergence at λ=10²:** Forward/backward metrics in A and D both approach 1.0–1.4, suggesting asymptotic behavior.
2. **Threshold at λ=1:**
- Panel A's random baseline and Panel C's WHR show abrupt changes.
- Panel D's mean weight drops sharply at λ=10.
3. **MFPT vs WHR Divergence:**
- MFPT drops early (λ=0.1–1), while WHR activates later (λ=1–10).
- Suggests MFPT reflects sensitivity to small λ, WHR to larger λ.
### Interpretation
The data demonstrates **λ-dependent performance thresholds**:
- **Forward metrics** (A, D) show rapid convergence to optimal values (1.4) as λ increases, outperforming random baselines.
- **Backward metrics** lag but follow similar trajectories, indicating directional asymmetry.
- **MFPT/WHR ratios** (B, C) reveal complementary dynamics: MFPT captures early-stage sensitivity, while WHR reflects late-stage stability.
- The **λ=10 threshold** in Panel D (mean weight drop) may indicate a phase transition or overfitting boundary.
These patterns suggest the system exhibits **scale-dependent optimization**, with forward metrics dominating at high λ and backward metrics maintaining relevance at intermediate scales. The random baseline comparisons highlight that observed trends are not artifacts of random initialization.