## Line Graph: Average Correct Flips Over Iterations
### Overview
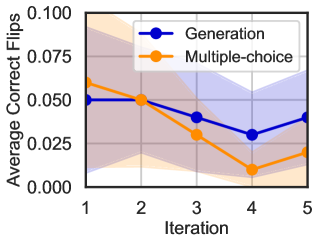
The image is a line graph comparing two methods ("Generation" and "Multiple-choice") across five iterations. The y-axis represents "Average Correct Flips" (0.000–0.100), and the x-axis represents "Iteration" (1–5). Shaded regions around each line indicate variability/confidence intervals.
### Components/Axes
- **X-axis (Iteration)**: Labeled "Iteration" with ticks at 1, 2, 3, 4, 5.
- **Y-axis (Average Correct Flips)**: Labeled "Average Correct Flips" with ticks at 0.000, 0.025, 0.050, 0.075, 0.100.
- **Legend**: Located in the top-right corner, with:
- **Blue line**: "Generation"
- **Orange line**: "Multiple-choice"
- **Shaded Regions**: Gray areas around each line, representing variability (wider for "Multiple-choice").
### Detailed Analysis
#### Generation (Blue Line)
- **Iteration 1**: ~0.050
- **Iteration 2**: ~0.050 (flat)
- **Iteration 3**: ~0.035
- **Iteration 4**: ~0.025
- **Iteration 5**: ~0.030
- **Trend**: Slight downward trend with a minor recovery in Iteration 5. Shaded region is narrow, indicating low variability.
#### Multiple-choice (Orange Line)
- **Iteration 1**: ~0.060
- **Iteration 2**: ~0.050
- **Iteration 3**: ~0.025
- **Iteration 4**: ~0.010
- **Iteration 5**: ~0.020
- **Trend**: Sharp decline from Iteration 1 to 4, followed by a partial recovery in Iteration 5. Shaded region is wide, indicating high variability.
### Key Observations
1. **Divergence in Performance**: "Generation" maintains higher average correct flips than "Multiple-choice" after Iteration 2.
2. **Volatility**: "Multiple-choice" shows significantly higher variability (wider shaded regions), especially in Iterations 3–4.
3. **Recovery in Iteration 5**: Both methods show slight increases in Iteration 5, but "Multiple-choice" remains below "Generation."
### Interpretation
The data suggests that the "Generation" method is more consistent and reliable over iterations, while "Multiple-choice" exhibits declining performance and greater uncertainty. The sharp drop in "Multiple-choice" (Iterations 3–4) may indicate methodological limitations or external factors affecting its effectiveness. The partial recovery in Iteration 5 for "Multiple-choice" could signal an adjustment or anomaly, but the overall trend underscores its inferior stability compared to "Generation."