\n
## Line Chart: Average Correct Flips vs. Iteration
### Overview
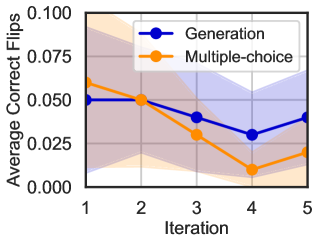
This image presents a line chart illustrating the relationship between the iteration number and the average number of correct flips for two different methods: "Generation" and "Multiple-choice". The chart displays the trend of these metrics over five iterations. Shaded regions around the lines indicate some measure of variance or uncertainty.
### Components/Axes
* **X-axis:** Labeled "Iteration", with markers at 1, 2, 3, 4, and 5.
* **Y-axis:** Labeled "Average Correct Flips", with a scale ranging from 0.000 to 0.100, incrementing by 0.025.
* **Data Series 1:** "Generation", represented by a blue line with diamond markers.
* **Data Series 2:** "Multiple-choice", represented by an orange line with circle markers.
* **Legend:** Located in the top-right corner, identifying the two data series and their corresponding colors.
* **Shaded Regions:** Light purple shading around the blue line and light orange shading around the orange line, representing a confidence interval or standard deviation.
### Detailed Analysis
**Generation (Blue Line):**
The blue line representing "Generation" initially starts at approximately 0.052 at Iteration 1. It then decreases to roughly 0.042 at Iteration 3, dips to a minimum of approximately 0.035 at Iteration 4, and rises slightly to around 0.045 at Iteration 5. The trend is generally decreasing, with a slight recovery in the final iteration.
**Multiple-choice (Orange Line):**
The orange line representing "Multiple-choice" begins at approximately 0.062 at Iteration 1. It steadily declines to around 0.048 at Iteration 2, continues to decrease to approximately 0.030 at Iteration 3, drops to a minimum of roughly 0.018 at Iteration 4, and then increases to approximately 0.025 at Iteration 5. This line exhibits a clear downward trend, followed by a slight increase in the final iteration.
**Data Points (Approximate):**
| Iteration | Generation (Average Correct Flips) | Multiple-choice (Average Correct Flips) |
|---|---|---|
| 1 | 0.052 | 0.062 |
| 2 | 0.050 | 0.048 |
| 3 | 0.042 | 0.030 |
| 4 | 0.035 | 0.018 |
| 5 | 0.045 | 0.025 |
### Key Observations
* The "Multiple-choice" method consistently shows a higher average correct flips value than the "Generation" method at Iteration 1 and 2.
* Both methods exhibit a decreasing trend in average correct flips from Iteration 1 to Iteration 4.
* Both methods show a slight increase in average correct flips at Iteration 5, suggesting a potential stabilization or recovery.
* The shaded regions indicate a degree of uncertainty or variability in the results for both methods. The shaded regions are wider for the "Multiple-choice" method, suggesting greater variability.
### Interpretation
The chart suggests that both the "Generation" and "Multiple-choice" methods initially perform well, but their effectiveness decreases with each iteration up to Iteration 4. The slight increase in performance at Iteration 5 could indicate that the methods are approaching a limit or that further iterations might not yield significant improvements. The "Multiple-choice" method appears to be more volatile, as indicated by the wider shaded regions, suggesting that its performance is more sensitive to variations in the data or process. The decreasing trend could be due to factors such as overfitting, diminishing returns, or the inherent difficulty of the task. Further investigation would be needed to determine the underlying causes of these trends and to identify strategies for improving the performance of both methods. The data suggests that the "Multiple-choice" method is initially superior, but both methods degrade in performance over time.