## Line Chart: Average Correct Flips vs. Iteration
### Overview
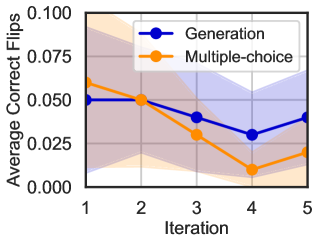
The image is a line chart comparing the performance of two methods, "Generation" and "Multiple-choice," across five iterations. The performance metric is "Average Correct Flips." The chart includes shaded regions representing confidence intervals or variability around each line.
### Components/Axes
* **Chart Type:** Line chart with shaded confidence bands.
* **X-Axis (Horizontal):**
* **Label:** "Iteration"
* **Scale:** Linear, with discrete integer markers from 1 to 5.
* **Y-Axis (Vertical):**
* **Label:** "Average Correct Flips"
* **Scale:** Linear, ranging from 0.000 to 0.100, with major tick marks at 0.000, 0.025, 0.050, 0.075, and 0.100.
* **Legend:**
* **Position:** Top-center of the plot area.
* **Items:**
1. **Blue line with circle markers:** "Generation"
2. **Orange line with circle markers:** "Multiple-choice"
* **Data Series & Confidence Bands:**
* **Generation (Blue):** A solid blue line with circular data points. It is surrounded by a light blue shaded area.
* **Multiple-choice (Orange):** A solid orange line with circular data points. It is surrounded by a light orange shaded area.
### Detailed Analysis
**Data Point Extraction (Approximate Values):**
| Iteration | Generation (Blue Line) | Multiple-choice (Orange Line) |
| :--- | :--- | :--- |
| 1 | ~0.050 | ~0.060 |
| 2 | ~0.050 | ~0.050 |
| 3 | ~0.040 | ~0.030 |
| 4 | ~0.030 | ~0.010 |
| 5 | ~0.040 | ~0.020 |
**Trend Verification:**
* **Generation (Blue):** The line shows a slight overall downward trend from iteration 1 to 4, with a partial recovery at iteration 5. It starts at ~0.050, dips to a low of ~0.030 at iteration 4, and rises back to ~0.040.
* **Multiple-choice (Orange):** The line shows a steeper downward trend from iteration 1 to 4, followed by a small rebound at iteration 5. It starts higher than Generation at ~0.060, falls to a low of ~0.010 at iteration 4, and recovers slightly to ~0.020.
**Confidence Interval Observation:**
* The shaded blue area (Generation) is notably wide at iterations 1 and 5, suggesting higher variance or uncertainty in the data at the beginning and end of the measured sequence.
* The shaded orange area (Multiple-choice) is generally narrower but also shows increased width at iteration 1.
### Key Observations
1. **Performance Crossover:** The "Multiple-choice" method starts with a higher average correct flips score than "Generation" at iteration 1. However, its performance degrades more rapidly, falling below the "Generation" line by iteration 3 and remaining below it for the rest of the chart.
2. **Common Low Point:** Both methods experience their lowest measured performance at iteration 4.
3. **Differential Recovery:** While both methods show a performance increase from iteration 4 to 5, the "Generation" method recovers more strongly, returning to a level close to its starting point, whereas the "Multiple-choice" method shows only a modest rebound.
4. **Volatility:** The "Multiple-choice" series exhibits greater volatility, with a larger relative drop from its peak to its trough compared to the "Generation" series.
### Interpretation
The data suggests a comparative analysis of two iterative processes. The "Generation" method demonstrates more stable and resilient performance over the five iterations. Although it starts slightly lower, it maintains a more consistent output, with a less severe decline and a stronger recovery.
In contrast, the "Multiple-choice" method shows an initial advantage that is not sustained. Its performance deteriorates significantly, indicating it may be more sensitive to the iterative process or encounters a bottleneck around iteration 4. The partial recovery at iteration 5 for both methods could indicate an adaptive mechanism or a change in conditions.
The wide confidence interval for "Generation" at the start and end implies that while its average performance is stable, individual runs or instances may vary considerably. The chart implies that for tasks measured by "Average Correct Flips" over multiple iterations, the "Generation" approach may offer more predictable and robust long-term results, despite a potentially slower start.