## Diagram: Effects Representation
### Overview
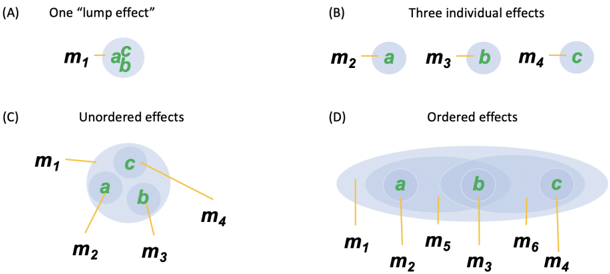
The image presents four diagrams (A, B, C, and D) illustrating different ways to represent effects, specifically "lumped," "individual," "unordered," and "ordered" effects. Each diagram uses circles, labels (m1, m2, etc.), and letters (a, b, c) to visually depict these concepts.
### Components/Axes
* **Diagram A:**
* Title: One "lump effect"
* Components: A single circle containing the letters "a", "b", and "c" in green. The circle is connected to the label "m1" with a yellow line.
* **Diagram B:**
* Title: Three individual effects
* Components: Three separate circles, each containing one of the letters "a", "b", or "c" in green. These circles are connected to the labels "m2" (for "a"), "m3" (for "b"), and "m4" (for "c") with yellow lines. The circles are arranged horizontally.
* **Diagram C:**
* Title: Unordered effects
* Components: Three smaller circles containing the letters "a", "b", and "c" in green, all enclosed within a larger, light blue circle. These are connected to labels "m1", "m2", "m3", and "m4" with yellow lines.
* **Diagram D:**
* Title: Ordered effects
* Components: Three overlapping circles, each containing one of the letters "a", "b", or "c" in green. The circles are nested within each other, creating an ordered sequence. These are connected to labels "m1", "m2", "m3", "m4", "m5", and "m6" with yellow lines.
### Detailed Analysis
* **Diagram A:** The "lump effect" combines all three effects (a, b, c) into a single entity associated with "m1".
* **Diagram B:** The "individual effects" diagram separates each effect (a, b, c) and associates them with distinct labels (m2, m3, m4).
* **Diagram C:** The "unordered effects" diagram groups the effects (a, b, c) within a single entity but does not imply any specific order. The labels m1, m2, m3, and m4 are connected to the larger circle.
* **Diagram D:** The "ordered effects" diagram shows the effects (a, b, c) in a specific sequence, indicated by the overlapping circles. The labels m1, m2, m3, m4, m5, and m6 are connected to the circles.
### Key Observations
* The diagrams use visual representations to distinguish between different ways of conceptualizing and representing effects.
* The use of circles and connecting lines creates a clear visual association between the effects (a, b, c) and the labels (m1, m2, etc.).
* The overlapping circles in Diagram D effectively convey the concept of ordered effects.
### Interpretation
The diagrams illustrate different approaches to modeling and representing effects in a system. Diagram A represents a simplified view where all effects are considered as a single, aggregated entity. Diagram B provides a detailed view where each effect is treated independently. Diagram C represents a scenario where the effects are grouped together but without a specific order. Diagram D represents a scenario where the effects occur in a specific sequence or hierarchy. The choice of representation depends on the specific context and the level of detail required for the analysis.