## Diagram: Causal Effect Models
### Overview
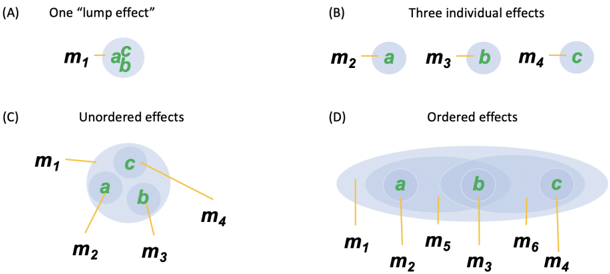
The image presents four diagrams (A-D) illustrating different configurations of causal relationships between variables labeled **m1-m4** and effects **a, b, c**. Each diagram uses arrows to denote influence and colored circles to group variables.
---
### Components/Axes
- **Variables**:
- **m1, m2, m3, m4**: Represented as blue circles with labels.
- **a, b, c**: Represented as green circles with labels.
- **Relationships**:
- Arrows indicate directional influence (e.g., **m1 → a**).
- Overlapping circles group variables (e.g., **a, b, c** in Diagram C).
- **Diagram Labels**:
- (A) "One 'lump effect'"
- (B) "Three individual effects"
- (C) "Unordered effects"
- (D) "Ordered effects"
---
### Detailed Analysis
#### Diagram A: One "lump effect"
- **Structure**:
- **m1** influences **a** and **b** (arrows from m1 to a and b).
- **c** is enclosed in a circle overlapping with a and b.
- **Interpretation**:
- Suggests a single variable (**m1**) drives multiple effects (**a, b**) with **c** as a shared component.
#### Diagram B: Three individual effects
- **Structure**:
- **m2 → a**, **m3 → b**, **m4 → c** (no overlapping circles).
- **Interpretation**:
- Each variable (**m2-m4**) independently affects a distinct effect (**a, b, c**).
#### Diagram C: Unordered effects
- **Structure**:
- **m1, m2, m3, m4** all connect to **a, b, c** (arrows from each m to all three effects).
- **a, b, c** are enclosed in a single circle.
- **Interpretation**:
- Multiple variables influence all effects simultaneously, with no hierarchical or sequential structure.
#### Diagram D: Ordered effects
- **Structure**:
- **a, b, c** are enclosed in a larger circle with sequential connections:
- **m1 → a**, **m5 → b**, **m6 → c**, **m4 → c**.
- Arrows suggest a stepwise progression (e.g., **a → b → c**).
- **Interpretation**:
- Effects are ordered hierarchically, with distinct variables driving each stage.
---
### Key Observations
1. **Diagram A** emphasizes a unified causal source (**m1**) for multiple effects.
2. **Diagram B** isolates effects to individual variables, eliminating overlap.
3. **Diagram C** introduces complexity with multiple variables influencing all effects.
4. **Diagram D** introduces ordering (e.g., **m5 → b** after **m1 → a**), implying temporal or hierarchical dependencies.
---
### Interpretation
The diagrams model varying degrees of causal complexity:
- **A** and **B** represent simplicity (single/multiple sources).
- **C** introduces redundancy (multiple variables affecting all effects).
- **D** adds structure, suggesting ordered processes (e.g., **a** precedes **b**, which precedes **c**).
The use of overlapping circles in **A** and **C** implies shared components or feedback loops, while **D**’s sequential arrows hint at a mechanistic or staged process. These models could apply to fields like systems biology, economics, or machine learning, where understanding causal hierarchies is critical.
No numerical data or trends are present; the focus is on structural relationships.