## Line Chart: Model Performance Comparison
### Overview
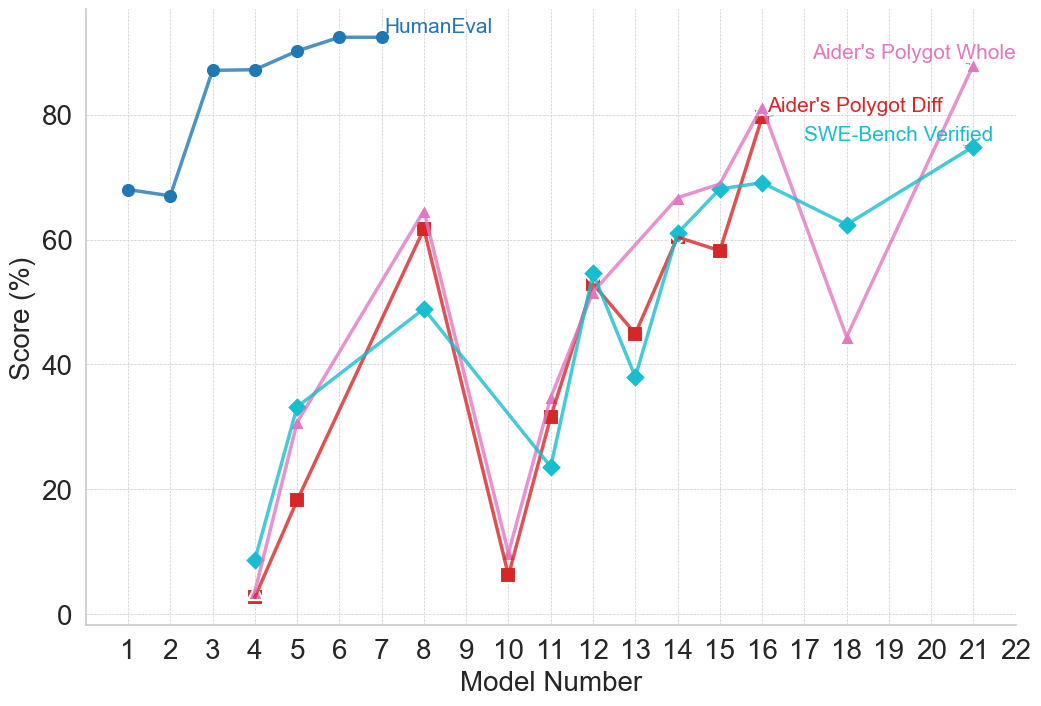
The image is a line chart comparing the performance of different models across a range of model numbers. The chart displays the "Score (%)" on the y-axis and "Model Number" on the x-axis. Four different data series are plotted: "HumanEval", "Aider's Polygot Whole", "Aider's Polygot Diff", and "SWE-Bench Verified".
### Components/Axes
* **X-axis:** "Model Number" ranging from 1 to 22.
* **Y-axis:** "Score (%)" ranging from 0 to 80.
* **Legend:** Located at the top-right of the chart, identifying the data series:
* "HumanEval" (Blue line with circle markers)
* "Aider's Polygot Whole" (Pink line with triangle markers)
* "Aider's Polygot Diff" (Red line with square markers)
* "SWE-Bench Verified" (Cyan line with diamond markers)
### Detailed Analysis
* **HumanEval (Blue):**
* Trend: Starts relatively low, rapidly increases, and then plateaus.
* Data Points:
* Model 1: ~68%
* Model 2: ~67%
* Model 4: ~86%
* Model 5: ~86%
* Model 6: ~89%
* Model 7: ~91%
* Model 8-22: ~91% (approximately constant)
* **Aider's Polygot Whole (Pink):**
* Trend: Highly variable, with peaks and troughs across different model numbers.
* Data Points:
* Model 4: ~33%
* Model 8: ~63%
* Model 10: ~8%
* Model 12: ~55%
* Model 16: ~80%
* Model 19: ~45%
* Model 21: ~75%
* **Aider's Polygot Diff (Red):**
* Trend: Similar to "Aider's Polygot Whole" but with some differences in magnitude.
* Data Points:
* Model 4: ~3%
* Model 5: ~19%
* Model 8: ~62%
* Model 10: ~6%
* Model 12: ~32%
* Model 13: ~45%
* Model 15: ~59%
* Model 16: ~79%
* **SWE-Bench Verified (Cyan):**
* Trend: Variable, with a general upward trend towards the end.
* Data Points:
* Model 4: ~10%
* Model 8: ~50%
* Model 11: ~24%
* Model 13: ~38%
* Model 14: ~62%
* Model 16: ~70%
* Model 18: ~62%
* Model 21: ~75%
### Key Observations
* "HumanEval" consistently outperforms the other models after Model 4.
* "Aider's Polygot Whole", "Aider's Polygot Diff", and "SWE-Bench Verified" show significant performance fluctuations across different model numbers.
* Models 8 and 16 appear to be high-performing models for "Aider's Polygot Whole" and "Aider's Polygot Diff".
* "SWE-Bench Verified" shows a general upward trend, especially after Model 11.
### Interpretation
The chart illustrates a comparison of model performance based on different evaluation metrics or datasets. "HumanEval" represents a benchmark that the other models are compared against. The variability in performance of "Aider's Polygot Whole", "Aider's Polygot Diff", and "SWE-Bench Verified" suggests that these models are more sensitive to the specific characteristics of the evaluated tasks or datasets. The "HumanEval" data suggests that the models quickly reach a performance plateau. The other models show more nuanced performance, suggesting that they may be better suited for certain tasks or model numbers.