## Line Chart: Model Performance Comparison
### Overview
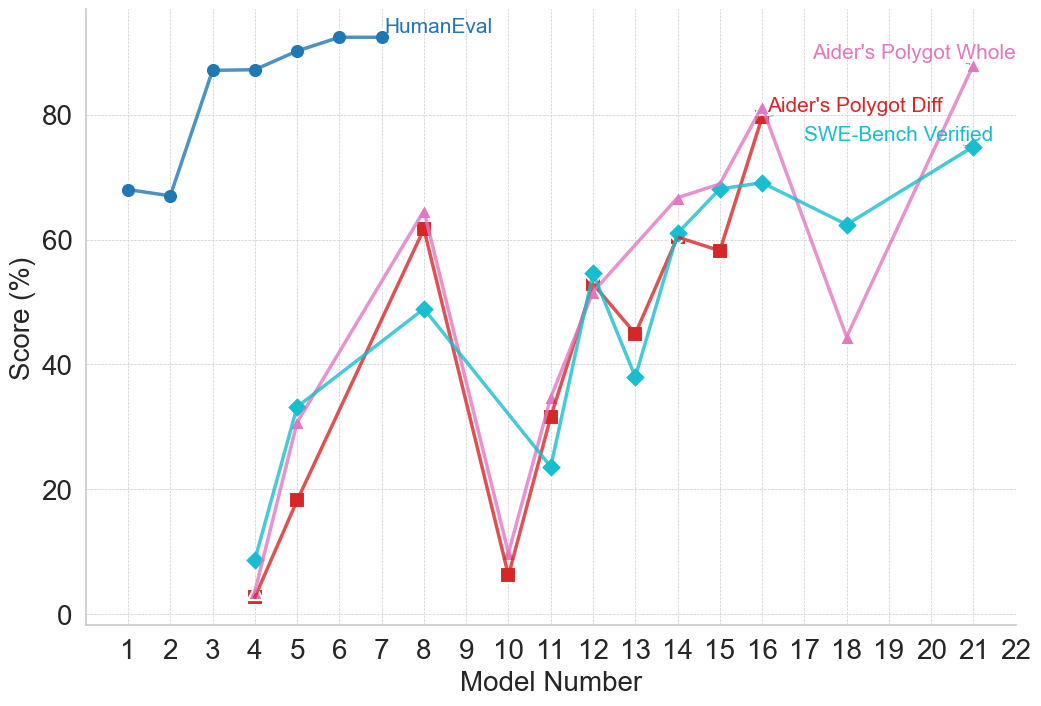
This line chart compares the performance scores of different models across a range of model numbers (1 to 22). The scores are presented as percentages and are evaluated using three different methods: HumanEval, Aider's Polygot Whole, Aider's Polygot Diff, and SWE-Bench Verified. The chart aims to illustrate how each model performs according to these evaluation metrics.
### Components/Axes
* **X-axis:** Model Number (ranging from 1 to 22, with tick marks at integer values).
* **Y-axis:** Score (%) (ranging from 0 to 100, with tick marks at 20, 40, 60, 80, and 100).
* **Lines:**
* HumanEval (Blue)
* Aider's Polygot Whole (Pink)
* Aider's Polygot Diff (Light Green)
* SWE-Bench Verified (Teal)
* **Legend:** Located in the top-right corner of the chart, identifying each line by color and name.
### Detailed Analysis
Here's a breakdown of the data series and their trends:
* **HumanEval (Blue):** The line starts at approximately 68% at Model 1, increases steadily to a peak of around 92% at Model 8, then plateaus between 88% and 92% for the remaining models (9-22).
* **Aider's Polygot Whole (Pink):** This line exhibits significant fluctuations. It begins at approximately 40% at Model 1, dips to around 18% at Model 5, rises sharply to a peak of approximately 82% at Model 16, then declines to around 65% at Model 22.
* **Aider's Polygot Diff (Light Green):** This line also shows considerable variation. It starts at approximately 5% at Model 1, increases to around 64% at Model 8, decreases to approximately 45% at Model 12, rises again to around 60% at Model 14, and ends at approximately 68% at Model 22.
* **SWE-Bench Verified (Teal):** This line starts at approximately 45% at Model 1, increases to around 60% at Model 6, decreases to approximately 48% at Model 11, rises to around 65% at Model 18, and ends at approximately 62% at Model 22.
Here's a more granular breakdown of the approximate values at specific model numbers:
| Model Number | HumanEval (%) | Aider's Polygot Whole (%) | Aider's Polygot Diff (%) | SWE-Bench Verified (%) |
|--------------|---------------|---------------------------|--------------------------|------------------------|
| 1 | 68 | 40 | 5 | 45 |
| 2 | 74 | 42 | 10 | 48 |
| 3 | 78 | 44 | 15 | 50 |
| 4 | 82 | 46 | 20 | 52 |
| 5 | 85 | 18 | 25 | 54 |
| 6 | 87 | 35 | 35 | 60 |
| 7 | 89 | 45 | 45 | 58 |
| 8 | 92 | 65 | 64 | 56 |
| 9 | 91 | 50 | 40 | 50 |
| 10 | 90 | 8 | 5 | 48 |
| 11 | 90 | 25 | 45 | 48 |
| 12 | 89 | 40 | 45 | 50 |
| 13 | 88 | 50 | 50 | 55 |
| 14 | 88 | 60 | 60 | 60 |
| 15 | 89 | 70 | 55 | 62 |
| 16 | 90 | 82 | 75 | 64 |
| 17 | 91 | 75 | 70 | 65 |
| 18 | 91 | 70 | 65 | 65 |
| 19 | 91 | 68 | 60 | 63 |
| 20 | 91 | 66 | 62 | 62 |
| 21 | 91 | 65 | 65 | 62 |
| 22 | 91 | 65 | 68 | 62 |
### Key Observations
* HumanEval consistently demonstrates the highest scores and the most stable performance across all models.
* Aider's Polygot Whole exhibits the most volatile performance, with large swings in scores.
* Aider's Polygot Diff and SWE-Bench Verified show moderate fluctuations, with some convergence in scores towards the end of the model range.
* There's a noticeable dip in Aider's Polygot Whole and Aider's Polygot Diff performance around Model 10.
* SWE-Bench Verified generally remains lower than HumanEval, but shows a slight upward trend towards the end.
### Interpretation
The data suggests that HumanEval is a robust and reliable metric for evaluating model performance, as it consistently yields high and stable scores. Aider's Polygot Whole, while capable of achieving high scores (particularly around Model 16), is more sensitive to variations in the models, indicating potential instability or a narrower range of applicability. The differences between Aider's Polygot Diff and SWE-Bench Verified suggest they assess different aspects of model capabilities. The dip in performance for Aider's Polygot Whole and Diff around Model 10 could indicate a specific challenge or weakness in those models at that point in their development. The convergence of SWE-Bench Verified and Aider's Polygot Diff towards the end suggests that these models may be reaching a similar level of performance on the specific tasks assessed by those metrics. Overall, the chart provides a comparative overview of model performance across different evaluation methods, highlighting the strengths and weaknesses of each model and metric.