## Bar Chart Analysis: Prompting Methods and LLM Performance
### Overview
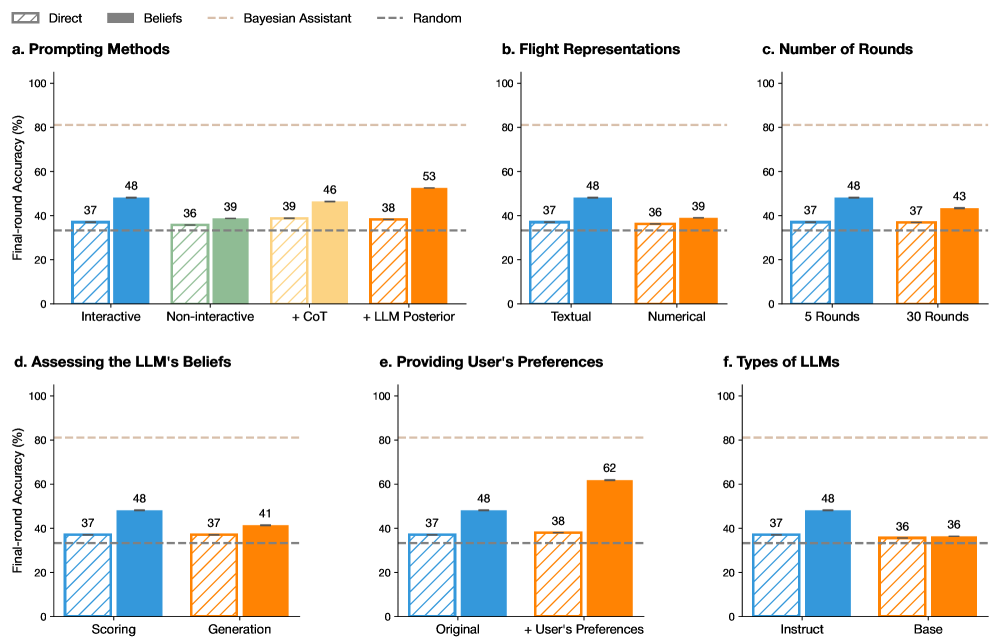
The image contains six grouped bar charts (a-f) comparing final-round accuracy (%) across different prompting methods, flight representations, rounds, belief assessments, user preferences, and LLM types. All charts share a consistent y-axis (0-100% accuracy) and x-axis categories specific to each subplot. A dashed line at ~37% represents a "Random" baseline, while a dotted line at ~80% marks an upper threshold.
---
### Components/Axes
**Legend (Top-left):**
- **Direct** (blue with diagonal stripes)
- **Beliefs** (green with diagonal stripes)
- **Bayesian Assistant** (orange with diagonal stripes)
- **Random** (gray dashed line at ~37%)
**Subplot Labels:**
- **a. Prompting Methods**
- X-axis: Interactive, Non-interactive, + CoT, + LLM Posterior
- **b. Flight Representations**
- X-axis: Textual, Numerical
- **c. Number of Rounds**
- X-axis: 5 Rounds, 30 Rounds
- **d. Assessing the LLM's Beliefs**
- X-axis: Scoring, Generation
- **e. Providing User's Preferences**
- X-axis: Original, + User's Preferences
- **f. Types of LLMs**
- X-axis: Instruct, Base
---
### Detailed Analysis
#### a. Prompting Methods
- **Interactive**:
- Direct: 37%
- Beliefs: 48%
- **Non-interactive**:
- Direct: 36%
- Beliefs: 39%
- **+ CoT**:
- Direct: 39%
- Beliefs: 46%
- **+ LLM Posterior**:
- Direct: 38%
- Beliefs: 53%
#### b. Flight Representations
- **Textual**:
- Direct: 37%
- Beliefs: 48%
- **Numerical**:
- Direct: 36%
- Beliefs: 39%
#### c. Number of Rounds
- **5 Rounds**:
- Direct: 37%
- Beliefs: 48%
- **30 Rounds**:
- Direct: 37%
- Beliefs: 43%
#### d. Assessing the LLM's Beliefs
- **Scoring**:
- Direct: 37%
- Beliefs: 48%
- **Generation**:
- Direct: 37%
- Beliefs: 41%
#### e. Providing User's Preferences
- **Original**:
- Direct: 37%
- Beliefs: 48%
- **+ User's Preferences**:
- Direct: 38%
- Beliefs: 62%
#### f. Types of LLMs
- **Instruct**:
- Direct: 37%
- Beliefs: 48%
- **Base**:
- Direct: 36%
- Beliefs: 36%
---
### Key Observations
1. **Beliefs > Direct**: Across all subplots, "Beliefs" consistently outperforms "Direct" prompting, with the largest gap in **e. Providing User's Preferences** (+62% vs. 38%).
2. **User Preferences Impact**: Adding user preferences in subplot **e** causes the largest accuracy jump (62%), suggesting personalization significantly enhances performance.
3. **LLM Type Neutrality**: Subplot **f** shows no difference between "Instruct" and "Base" LLMs, indicating architectural differences may not affect outcomes under these methods.
4. **Diminishing Returns**: Increasing rounds from 5 to 30 in subplot **c** yields minimal improvement (48% → 43% for Beliefs), implying saturation.
5. **Random Baseline**: All "Direct" methods cluster near the 37% Random line, while "Beliefs" consistently exceeds it.
---
### Interpretation
- **Effective Strategies**:
- **Beliefs prompting** (e.g., incorporating LLM-generated beliefs) and **user preference integration** are the most impactful methods, outperforming direct instruction by 10-25%.
- **Flight representations** (Textual vs. Numerical) show mixed results, with Textual slightly better for Beliefs.
- **LLM Agnosticism**: The lack of difference between "Instruct" and "Base" LLMs suggests prompting method matters more than model architecture.
- **Diminishing Returns**: Extended rounds (30 vs. 5) show negligible gains, highlighting efficiency trade-offs.
- **Outlier**: The 62% accuracy in subplot **e** (+User Preferences) is an extreme outlier, warranting deeper investigation into why personalization drives such high performance.
This analysis underscores the importance of belief-aware prompting and user-centric customization in optimizing LLM performance, while cautioning against over-reliance on extended interaction rounds or architectural complexity.