## Horizontal Grouped Bar Chart: LLM Accuracy on Cause vs. Effect Tasks
### Overview
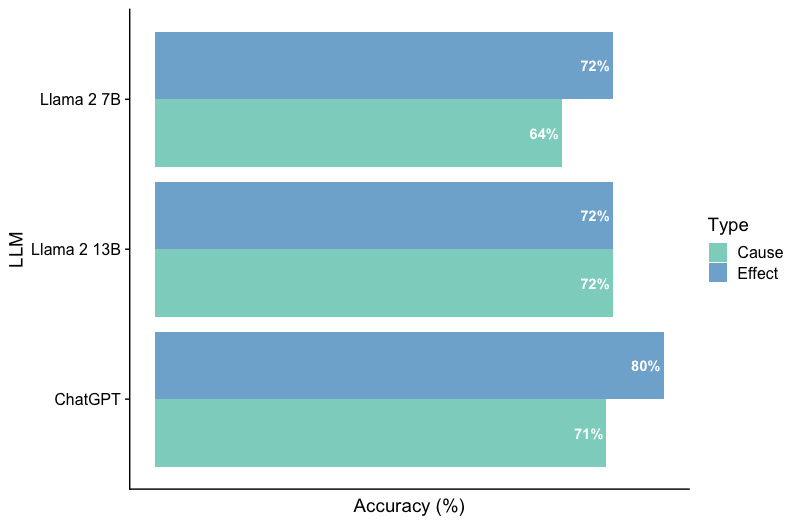
The image displays a horizontal grouped bar chart comparing the performance of three Large Language Models (LLMs) on two distinct task types: "Cause" and "Effect." The chart measures performance in terms of accuracy percentage.
### Components/Axes
* **Chart Type:** Horizontal Grouped Bar Chart.
* **Y-Axis (Vertical):** Labeled "LLM". It lists three models from top to bottom:
1. Llama 2 7B
2. Llama 2 13B
3. ChatGPT
* **X-Axis (Horizontal):** Labeled "Accuracy (%)". The axis has numerical markers at 0, 20, 40, 60, 80, and 100.
* **Legend:** Positioned on the right side of the chart, titled "Type". It defines the color coding:
* **Cause:** Represented by a teal/green color.
* **Effect:** Represented by a blue color.
* **Data Labels:** Each bar has its exact accuracy percentage printed at its end.
### Detailed Analysis
The chart presents paired bars for each LLM, showing accuracy for "Cause" and "Effect" tasks.
**1. Llama 2 7B (Top Group)**
* **Effect (Blue Bar):** The bar extends to the 72% mark. **Trend:** This is the higher-performing task for this model.
* **Cause (Teal Bar):** The bar extends to the 64% mark. **Trend:** This is the lower-performing task for this model.
* **Comparison:** The model shows an 8 percentage point higher accuracy on "Effect" tasks compared to "Cause" tasks.
**2. Llama 2 13B (Middle Group)**
* **Effect (Blue Bar):** The bar extends to the 72% mark.
* **Cause (Teal Bar):** The bar extends to the 72% mark.
* **Comparison:** The model demonstrates perfectly balanced performance, with identical accuracy on both task types.
**3. ChatGPT (Bottom Group)**
* **Effect (Blue Bar):** The bar extends to the 80% mark. **Trend:** This is the highest accuracy value shown on the entire chart.
* **Cause (Teal Bar):** The bar extends to the 71% mark.
* **Comparison:** The model shows a 9 percentage point higher accuracy on "Effect" tasks compared to "Cause" tasks.
### Key Observations
1. **Performance Hierarchy:** ChatGPT achieves the highest single accuracy score (80% on Effect). Llama 2 7B has the lowest single score (64% on Cause).
2. **Task Difficulty Pattern:** For two of the three models (Llama 2 7B and ChatGPT), the "Effect" task yields higher accuracy than the "Cause" task. Llama 2 13B is the exception with equal performance.
3. **Model Scaling (Llama 2):** Increasing the model size from 7B to 13B parameters significantly improved accuracy on the "Cause" task (from 64% to 72%, an 8-point gain) while maintaining the same accuracy on the "Effect" task (72%).
4. **Overall Range:** Accuracy scores across all models and tasks range from 64% to 80%, a spread of 16 percentage points.
### Interpretation
This chart provides a comparative snapshot of LLM capabilities in causal reasoning, segmented into understanding causes versus predicting effects.
* **What the data suggests:** The data indicates that, for the evaluated models and tasks, predicting or understanding *effects* may be a slightly easier or better-learned capability than identifying *causes*. This could reflect biases in training data (more effect descriptions) or an inherent complexity difference in the tasks as framed.
* **How elements relate:** The direct side-by-side comparison for each model isolates the task-type variable, allowing for a clear assessment of each model's strengths and weaknesses within causal reasoning. The scaling comparison within the Llama 2 family shows that increased model capacity primarily benefits the more challenging task ("Cause" for the 7B model).
* **Notable patterns/anomalies:** The perfect balance (72%/72%) of Llama 2 13B is a notable pattern, suggesting a different internal representation or training outcome compared to its smaller sibling and ChatGPT. The consistent outperformance of "Effect" tasks by the other two models is the dominant trend. The chart does not provide context on the specific datasets or evaluation methodologies used, which is critical for a full interpretation of these accuracy figures.