## Line Chart: Overlaps vs. HMC Steps
### Overview
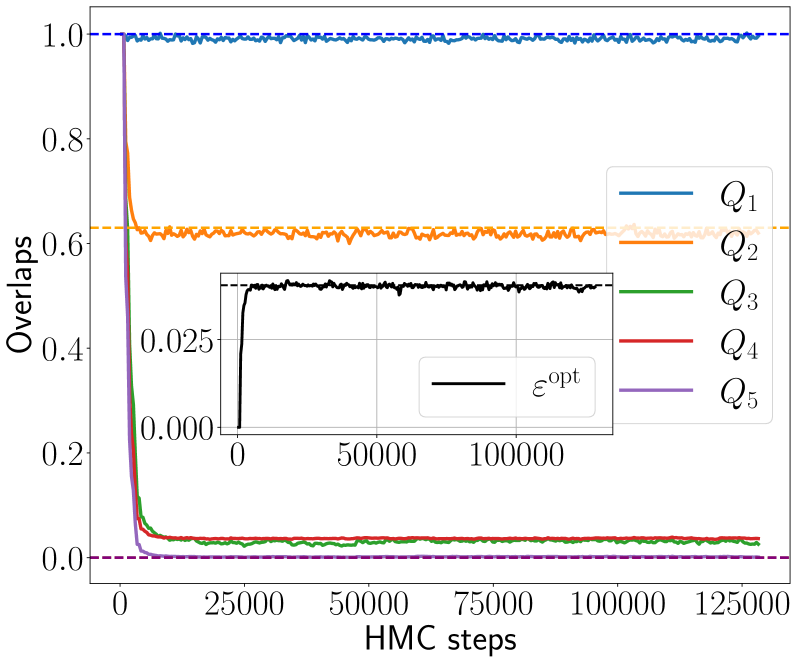
The image is a line chart showing the relationship between "Overlaps" and "HMC steps". There are five data series, labeled Q1 through Q5, each represented by a different colored line. An inset plot shows the behavior of "εopt" over HMC steps.
### Components/Axes
* **X-axis:** "HMC steps", ranging from 0 to 125000 in increments of 25000.
* **Y-axis:** "Overlaps", ranging from 0.0 to 1.0 in increments of 0.2.
* **Legend:** Located on the right side of the main plot, identifying the lines as Q1 (blue), Q2 (orange), Q3 (green), Q4 (red), and Q5 (purple).
* **Inset Plot X-axis:** HMC steps, ranging from 0 to 100000.
* **Inset Plot Y-axis:** Values ranging from 0.000 to 0.025.
* **Inset Plot Legend:** "εopt" (black).
* **Horizontal Dashed Lines:** There are four horizontal dashed lines corresponding to the approximate steady-state values of Q1, Q2, Q5, and εopt.
### Detailed Analysis
* **Q1 (Blue):** Starts at approximately 1.0 and remains relatively constant around 0.99.
* Horizontal dashed line at y = 1.0
* **Q2 (Orange):** Starts at approximately 0.75 and decreases rapidly before stabilizing around 0.62.
* Horizontal dashed line at y = 0.62
* **Q3 (Green):** Starts at approximately 0.75 and decreases rapidly before stabilizing around 0.03.
* **Q4 (Red):** Starts at approximately 0.75 and decreases rapidly before stabilizing around 0.04.
* **Q5 (Purple):** Starts at approximately 0.75 and decreases rapidly before stabilizing around 0.01.
* Horizontal dashed line at y = 0.0
* **εopt (Black - Inset Plot):** Starts at 0.0 and increases rapidly to approximately 0.026, then fluctuates around that value.
* Horizontal dashed line at y = 0.026
### Key Observations
* Q1 maintains a high overlap value throughout the HMC steps.
* Q2, Q3, Q4, and Q5 all exhibit a rapid decrease in overlap early in the HMC steps, followed by stabilization at lower values.
* εopt rapidly converges to a stable value.
### Interpretation
The chart illustrates the convergence behavior of different "overlap" metrics (Q1-Q5) during a Hamiltonian Monte Carlo (HMC) simulation. Q1 appears to represent a highly stable or conserved quantity, while Q2-Q5 converge to lower overlap values, suggesting a change or adaptation in the system being modeled. The inset plot shows that the parameter εopt quickly reaches an optimal value, which may be related to the convergence of the other overlap metrics. The horizontal dashed lines indicate the approximate steady-state values for each series.