## Chart: Proportion of Flips vs. Iterations for Qwen2.5-14B
### Overview
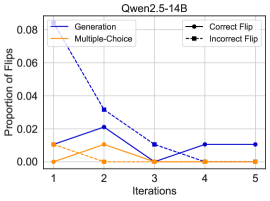
The image is a line chart comparing the proportion of flips across iterations for different methods (Generation, Multiple-Choice) and flip types (Correct Flip, Incorrect Flip) using the Qwen2.5-14B model. The x-axis represents iterations (1 to 5), and the y-axis represents the proportion of flips.
### Components/Axes
* **Title:** Qwen2.5-14B
* **X-axis:** Iterations (labeled 1, 2, 3, 4, 5)
* **Y-axis:** Proportion of Flips (labeled 0.00, 0.02, 0.04, 0.06, 0.08)
* **Legend (top-left):**
* Generation (solid blue line)
* Multiple-Choice (solid orange line)
* **Legend (top-right):**
* Correct Flip (black line with circle markers)
* Incorrect Flip (black dashed line with square markers)
### Detailed Analysis
* **Generation (solid blue line):**
* Trend: Decreasing from iteration 1 to 3, then relatively stable.
* Data Points:
* Iteration 1: ~0.07
* Iteration 2: ~0.032
* Iteration 3: ~0.01
* Iteration 4: ~0.01
* Iteration 5: ~0.01
* **Multiple-Choice (solid orange line):**
* Trend: Increasing from iteration 1 to 2, then decreasing to iteration 3, then increasing to iteration 4, then decreasing to iteration 5.
* Data Points:
* Iteration 1: ~0.01
* Iteration 2: ~0.01
* Iteration 3: ~0.00
* Iteration 4: ~0.01
* Iteration 5: ~0.00
* **Correct Flip (black line with circle markers):**
* Trend: Relatively stable.
* Data Points:
* Iteration 1: ~0.01
* Iteration 2: ~0.02
* Iteration 3: ~0.00
* Iteration 4: ~0.01
* Iteration 5: ~0.01
* **Incorrect Flip (black dashed line with square markers):**
* Trend: Decreasing.
* Data Points:
* Iteration 1: ~0.01
* Iteration 2: ~0.00
* Iteration 3: ~0.00
* Iteration 4: ~0.00
* Iteration 5: ~0.00
### Key Observations
* The "Generation" method starts with a significantly higher proportion of flips compared to "Multiple-Choice," but decreases rapidly over the first few iterations.
* The "Multiple-Choice" method has a relatively low and stable proportion of flips across all iterations.
* The "Correct Flip" method has a relatively low and stable proportion of flips across all iterations.
* The "Incorrect Flip" method has a decreasing proportion of flips across all iterations.
### Interpretation
The chart suggests that the "Generation" method initially struggles with a higher rate of flips, but quickly improves with iterations. The "Multiple-Choice" method maintains a consistently low flip rate, indicating a more stable performance. The "Correct Flip" and "Incorrect Flip" methods have a relatively low proportion of flips across all iterations, suggesting that the model is generally performing well in terms of flip accuracy. The decreasing trend of "Incorrect Flip" suggests that the model is learning to avoid incorrect flips over time. The data demonstrates the impact of iterative refinement on the performance of the Qwen2.5-14B model, particularly for the "Generation" method.