## Line Chart: Qwen2.5-14B - Proportion of Flips vs. Iterations
### Overview
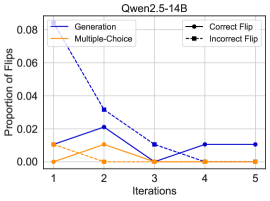
This line chart depicts the proportion of flips observed across different iterations for a model named Qwen2.5-14B. The chart compares the performance of "Generation" and "Multiple-Choice" methods against "Correct Flip" and "Incorrect Flip" outcomes. The x-axis represents the iteration number (from 1 to 5), and the y-axis represents the proportion of flips, ranging from 0 to 0.08.
### Components/Axes
* **Title:** Qwen2.5-14B
* **X-axis Label:** Iterations (with markers at 1, 2, 3, 4, and 5)
* **Y-axis Label:** Proportion of Flips (with markers at 0, 0.02, 0.04, 0.06, and 0.08)
* **Legend:**
* Generation (Blue solid line)
* Multiple-Choice (Orange solid line)
* Correct Flip (Black dashed line)
* Incorrect Flip (Black dotted line)
### Detailed Analysis
The chart contains four distinct data series, each represented by a different line style and color as defined in the legend.
* **Generation (Blue Solid Line):** This line shows a strong downward trend from Iteration 1 to Iteration 3, then plateaus.
* Iteration 1: Approximately 0.073
* Iteration 2: Approximately 0.034
* Iteration 3: Approximately 0.008
* Iteration 4: Approximately 0.011
* Iteration 5: Approximately 0.011
* **Multiple-Choice (Orange Solid Line):** This line exhibits a fluctuating pattern.
* Iteration 1: Approximately 0.014
* Iteration 2: Approximately 0.018
* Iteration 3: Approximately 0.004
* Iteration 4: Approximately 0.002
* Iteration 5: Approximately 0.002
* **Correct Flip (Black Dashed Line):** This line shows a decreasing trend from Iteration 1 to Iteration 4, then stabilizes.
* Iteration 1: Approximately 0.016
* Iteration 2: Approximately 0.003
* Iteration 3: Approximately 0.001
* Iteration 4: Approximately 0.001
* Iteration 5: Approximately 0.011
* **Incorrect Flip (Black Dotted Line):** This line shows a decreasing trend from Iteration 1 to Iteration 3, then a slight increase.
* Iteration 1: Approximately 0.014
* Iteration 2: Approximately 0.002
* Iteration 3: Approximately 0.001
* Iteration 4: Approximately 0.001
* Iteration 5: Approximately 0.011
### Key Observations
* The "Generation" method starts with the highest proportion of flips and experiences a significant decrease over the first three iterations.
* The "Multiple-Choice" method has a relatively low and stable proportion of flips throughout the iterations.
* Both "Correct Flip" and "Incorrect Flip" have very low proportions of flips, generally below 0.01, except for iteration 5.
* There is a notable increase in both "Correct Flip" and "Incorrect Flip" at Iteration 5, suggesting a potential change in behavior or a convergence point.
### Interpretation
The data suggests that the "Generation" method initially undergoes a substantial adjustment or learning process, as evidenced by the rapid decrease in the proportion of flips. This could indicate that the model is refining its output and reducing errors. The "Multiple-Choice" method, on the other hand, appears to be more stable and requires less adjustment. The low proportions of "Correct Flip" and "Incorrect Flip" suggest that the model is generally avoiding these types of outcomes. The increase in both "Correct Flip" and "Incorrect Flip" at Iteration 5 could indicate a point where the model starts exploring different solutions or encountering more challenging cases. The chart provides insights into the iterative learning process of the Qwen2.5-14B model and the relative performance of different methods. The data suggests that the "Generation" method benefits from iterative refinement, while the "Multiple-Choice" method is more consistent.