## Line Chart: Qwen2.5-14B - Proportion of Flips Over Iterations
### Overview
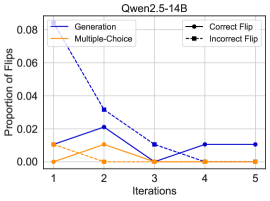
The image is a line chart titled "Qwen2.5-14B" that plots the "Proportion of Flips" against "Iterations" for four different data series. The chart appears to track the frequency of certain events (flips) across five sequential iterations for a model or process named Qwen2.5-14B.
### Components/Axes
* **Title:** "Qwen2.5-14B" (located at the top center).
* **X-Axis:** Labeled "Iterations". It has discrete markers at integer values: 1, 2, 3, 4, 5.
* **Y-Axis:** Labeled "Proportion of Flips". The scale ranges from 0.00 to 0.08, with major tick marks at intervals of 0.02 (0.00, 0.02, 0.04, 0.06, 0.08).
* **Legend:** Located in the top-right corner of the plot area. It defines four series:
* **Generation:** Solid blue line.
* **Multiple-Choice:** Solid orange line.
* **Correct Flip:** Dashed blue line.
* **Incorrect Flip:** Dashed orange line.
### Detailed Analysis
The following data points are approximate values extracted from the chart's visual representation.
**1. Generation (Solid Blue Line):**
* **Trend:** Shows a small peak at iteration 2 before declining and stabilizing.
* **Data Points:**
* Iteration 1: ~0.01
* Iteration 2: ~0.02 (peak)
* Iteration 3: ~0.00
* Iteration 4: ~0.01
* Iteration 5: ~0.01
**2. Multiple-Choice (Solid Orange Line):**
* **Trend:** Starts at a low level and quickly drops to zero, remaining there.
* **Data Points:**
* Iteration 1: ~0.01
* Iteration 2: ~0.00
* Iteration 3: ~0.00
* Iteration 4: ~0.00
* Iteration 5: ~0.00
**3. Correct Flip (Dashed Blue Line):**
* **Trend:** Exhibits a steep, monotonic decline from a high initial value, leveling off after iteration 3.
* **Data Points:**
* Iteration 1: ~0.08 (highest value on the chart)
* Iteration 2: ~0.03
* Iteration 3: ~0.01
* Iteration 4: ~0.01
* Iteration 5: ~0.01
**4. Incorrect Flip (Dashed Orange Line):**
* **Trend:** Starts low and drops to zero immediately, showing no activity after the first iteration.
* **Data Points:**
* Iteration 1: ~0.01
* Iteration 2: ~0.00
* Iteration 3: ~0.00
* Iteration 4: ~0.00
* Iteration 5: ~0.00
### Key Observations
1. **Dominant Series:** The "Correct Flip" series has the highest initial proportion (0.08) and the most dramatic change, accounting for the majority of the "flips" at the start.
2. **Convergence:** By Iteration 3, three of the four series ("Generation", "Correct Flip", "Incorrect Flip") converge to a very low proportion (~0.01 or 0.00). "Multiple-Choice" converges to zero by Iteration 2.
3. **Stability:** From Iteration 3 to 5, all series show stable, low proportions, indicating the process being measured reaches a steady state.
4. **Initial Activity:** All measurable activity (non-zero proportions) occurs primarily in the first two iterations. Iterations 3, 4, and 5 show minimal to no change.
### Interpretation
This chart likely illustrates the performance or behavior of the Qwen2.5-14B model over sequential refinement or testing steps (iterations). The "Proportion of Flips" could refer to changes in model outputs, corrections, or errors.
* **Learning/Correction Curve:** The steep decline in "Correct Flip" suggests the model makes many correct adjustments or corrections early on (Iteration 1), which rapidly diminish as it stabilizes. This is a classic sign of a learning or optimization process where major errors are fixed first.
* **Negligible Incorrect Changes:** The "Incorrect Flip" series is only non-zero at the very start and is always equal to or lower than the "Correct Flip" proportion. This indicates that when the model does change its output ("flip"), it is far more likely to be a correct adjustment than an incorrect one, especially after the first iteration.
* **Task-Specific Behavior:** The difference between "Generation" and "Multiple-Choice" lines suggests the model's behavior varies by task type. The "Generation" task shows a small, transient increase in flips at Iteration 2, while the "Multiple-Choice" task stabilizes almost immediately.
* **Overall Conclusion:** The data demonstrates a model that undergoes a brief period of significant, predominantly correct self-correction or adaptation in the first 1-2 iterations, after which its outputs become highly stable. The process is efficient, with incorrect flips being minimal and short-lived.